List of world regions by life expectancy
Jump to navigation
Jump to search
This article covers world regions by life expectancy in a list form

List by the World Bank Group (2020)
Data of the World Bank Group for 2020.[1][2][3] The values in the World Bank Group tables are rounded. All calculations are based on raw data, so due to the nuances of rounding, in some places illusory inconsistencies of indicators arose, with a size of 0.01 year.
| Countries | all | male | female | gender gap |
Δ 2019 all |
Δ 2019 male |
Δ 2019 female |
Δ 2019 gen. gap |
|---|---|---|---|---|---|---|---|---|
| European Union | 80.47 | 77.75 | 83.33 | 5.57 | -0.85 | -0.91 | -0.78 | 0.13 |
| North America | 77.74 | 75.04 | 80.58 | 5.54 | -1.38 | -1.64 | -1.11 | 0.54 |
| Europe & Central Asia | 77.03 | 73.92 | 80.33 | 6.42 | -1.15 | -1.18 | -1.09 | 0.09 |
| East Asia & Pacific | 76.76 | 73.99 | 79.70 | 5.71 | -0.03 | -0.09 | 0.04 | 0.14 |
| Central Europe & the Baltics | 76.14 | 72.45 | 80.03 | 7.59 | -1.12 | -1.26 | -0.98 | 0.28 |
| Latin America & Caribbean | 73.04 | 69.67 | 76.60 | 6.93 | -2.00 | -2.28 | -1.58 | 0.71 |
| Middle East & North Africa | 72.95 | 70.81 | 75.32 | 4.51 | -1.01 | -1.05 | -0.92 | 0.12 |
| World | 72.27 | 69.82 | 74.88 | 5.06 | -0.71 | -0.80 | -0.59 | 0.21 |
| Arab World | 70.92 | 68.94 | 73.11 | 4.18 | -0.92 | -0.97 | -0.83 | 0.14 |
| South Asia | 69.75 | 68.04 | 71.61 | 3.57 | -0.72 | -0.83 | -0.59 | 0.24 |
| Africa Eastern & Southern | 63.31 | 60.82 | 65.84 | 5.02 | -0.44 | -0.47 | -0.38 | 0.09 |
| Sub-Saharan Africa | 60.85 | 58.90 | 62.83 | 3.93 | -0.40 | -0.46 | -0.31 | 0.15 |
| Africa Western & Central | 57.23 | 56.13 | 58.35 | 2.22 | -0.33 | -0.45 | -0.20 | 0.25 |
List by the World Bank Group (2019)
Data of the World Bank Group for 2019.[1][2][3]
| Countries | all | male | female | gender gap |
Δ 2014 |
Δ 2000 |
|---|---|---|---|---|---|---|
| European Union | 81.31 | 78.67 | 84.11 | 5.44 | 0.44 | 4.24 |
| North America | 79.12 | 76.68 | 81.69 | 5.01 | -0.01 | 2.24 |
| Europe & Central Asia | 78.17 | 75.10 | 81.42 | 6.32 | 0.88 | 5.04 |
| Central Europe & the Baltics | 77.27 | 73.70 | 81.02 | 7.31 | 0.59 | 4.55 |
| East Asia & Pacific | 76.80 | 74.09 | 79.66 | 5.57 | 1.07 | 5.24 |
| Latin America & Caribbean | 75.04 | 71.95 | 78.18 | 6.22 | 0.49 | 3.81 |
| Middle East & North Africa | 73.96 | 71.86 | 76.25 | 4.38 | 1.34 | 4.68 |
| World | 72.98 | 70.62 | 75.47 | 4.85 | 1.10 | 5.28 |
| Arab World | 71.84 | 69.91 | 73.94 | 4.03 | 1.35 | 4.55 |
| South Asia | 70.47 | 68.87 | 72.20 | 3.33 | 1.84 | 7.58 |
| Africa Eastern & Southern | 63.76 | 61.29 | 66.22 | 4.93 | 2.42 | 11.79 |
| Sub-Saharan Africa | 61.24 | 59.36 | 63.14 | 3.77 | 2.10 | 9.98 |
| Africa Western & Central | 57.56 | 56.58 | 58.55 | 1.97 | 1.63 | 7.33 |
List by World Health Organization (2019)
Data of the World Health Organization for 2019, published in December 2020.[4]
| WHO regions[5] | Life expectancy at birth | HALE at birth | Life expectancy at age 60 | HALE at age 60 | ||||||||||||||||
|---|---|---|---|---|---|---|---|---|---|---|---|---|---|---|---|---|---|---|---|---|
| All | M | F | FΔM | Δ 2000 |
All | M | F | FΔM | Δ 2000 |
All | M | F | FΔM | Δ 2000 |
All | M | F | FΔM | Δ 2000 | |
| Europe[6] | 78.2 | 75.1 | 81.3 | 6.2 | 5.7 | 68.3 | 66.6 | 70.0 | 3.4 | 4.6 | 22.5 | 20.5 | 24.3 | 3.8 | 2.9 | 17.1 | 15.8 | 18.3 | 2.5 | 2.1 |
| Western Pacific[7] | 77.7 | 74.8 | 80.8 | 6.0 | 5.3 | 68.6 | 67.0 | 70.2 | 3.2 | 4.3 | 21.8 | 19.8 | 23.9 | 4.1 | 2.5 | 16.5 | 15.4 | 17.7 | 2.3 | 1.8 |
| Americas[8] | 77.2 | 74.5 | 79.8 | 5.3 | 3.1 | 66.2 | 64.8 | 67.5 | 2.7 | 2.1 | 22.7 | 21.2 | 24.0 | 2.8 | 1.6 | 16.6 | 15.7 | 17.4 | 1.7 | 0.9 |
| World | 73.3 | 70.8 | 75.9 | 5.1 | 6.5 | 63.7 | 62.5 | 64.9 | 2.4 | 5.4 | 21.1 | 19.5 | 22.7 | 3.2 | 2.3 | 15.8 | 14.8 | 16.6 | 1.8 | 1.7 |
| South-East Asia[9] | 71.4 | 69.9 | 73.1 | 3.2 | 8.0 | 61.5 | 61.1 | 61.9 | 0.8 | 7.0 | 19.1 | 18.2 | 20.0 | 1.8 | 2.5 | 13.7 | 13.3 | 14.1 | 0.8 | 1.7 |
| Eastern Mediterranean[10] | 69.7 | 68.3 | 71.3 | 3.0 | 4.7 | 60.4 | 60.2 | 60.7 | 0.5 | 3.8 | 18.5 | 17.8 | 19.3 | 1.5 | 1.1 | 13.6 | 13.4 | 13.9 | 0.5 | 0.7 |
| Africa[11] | 64.5 | 62.4 | 66.6 | 4.2 | 11.8 | 56.0 | 55.0 | 57.1 | 2.1 | 10.2 | 17.9 | 16.7 | 19.0 | 2.3 | 2.4 | 13.3 | 12.6 | 13.9 | 1.3 | 1.8 |
-
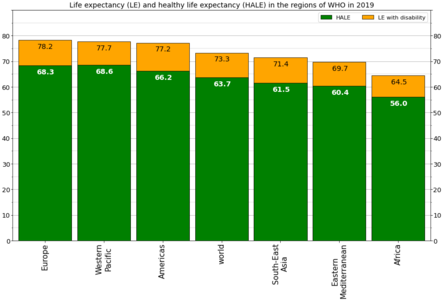
Life expectancy and HALE in regions of WHO in 2019
-

Elaboration by gender


See also
References
- ↑ 1.0 1.1 "Life expectancy at birth, total". The World Bank Group. 22 December 2022. Retrieved 18 February 2023.
- ↑ 2.0 2.1 "Life expectancy at birth, male". The World Bank Group. 22 December 2022. Archived from the original on 23 April 2022. Retrieved 18 February 2023.
- ↑ 3.0 3.1 "Life expectancy at birth, female". The World Bank Group. 22 December 2022. Archived from the original on 23 April 2022. Retrieved 18 February 2023.
- ↑ "Life expectancy and Healthy life expectancy, data by WHO region". World Health Organization. 7 December 2020. Archived from the original on 27 May 2016. Retrieved 19 February 2023.
- ↑ "WHO: Countries". World Health Organization. Archived from the original on 25 August 2004. Retrieved 7 May 2022.
- ↑ "WHO: Europe: Countries". World Health Organization. Archived from the original on 11 May 2022. Retrieved 7 May 2022.
- ↑ "WHO: Western Pacific: Where we work". World Health Organization. Archived from the original on 7 October 2018. Retrieved 7 May 2022.
- ↑ "WHO: PAHO: Countries and Centers". World Health Organization. Archived from the original on 10 May 2022. Retrieved 7 May 2022.
- ↑ "WHO: South-East Asia: Where we work". World Health Organization. Archived from the original on 6 April 2022. Retrieved 7 May 2022.
- ↑ "WHO: Eastern Mediterranean: Countries". World Health Organization. Archived from the original on 12 May 2022. Retrieved 7 May 2022.
- ↑ "WHO: Africa: Countries". World Health Organization. Archived from the original on 11 July 2017. Retrieved 7 May 2022.