As per the 2016 Census, 17.0% of York Centre residents are of Filipino ethnic origin and 16.0% belong to the Filipino visible minority, which are the highest such figures among all City of Toronto ridings. At the same time, the York Centre riding has the highest percentage of residents of Russian (9.5%) and Jewish (5.6%) ethnic origins (in the 2011 National Household Survey, 13.6% of York Centre residents had entered a Jewish ethnic origin).
The riding was previously considered one of the safest Liberal Party seats in Canada; however, this changed as the Conservative Party gained ground in the 2000s, and its candidate Mark Adler won the seat in 2011. However, the Liberal Party regained the seat in 2015 with its candidate Michael Levitt. Levitt was re-elected in 2019, and resigned as of September 1, 2020, to become the CEO of the Friends of Simon Wiesenthal Center for Holocaust Studies.[3] A by-election to fill the vacancy took place on October 26, 2020, which was won by Liberal Ya'ara Saks.[4][5]
Ethnic groups: 46.9% White, 19.3% Filipino, 8.0% Black, 5.4% Latin American, 4.1% South Asian, 3.7% Southeast Asian, 3.3% Chinese, 2.5% West Asian, 1.6% Korean Languages: 42.0% English, 9.5% Tagalog, 6.3% Russian, 5.2% Italian, 5.1% Spanish, 2.1% Vietnamese, 1.6% Portuguese, 1.5% Ilocano, 1.4% Korean, 1.3% Mandarin, 1.1% Cantonese, 1.1% Turkish, 1.1% Persian Religions: 57.3% Christian (36.0% Catholic, 4.4% Christian Orthodox, 1.7% Pentecostal, 15.2% other), 14.3% Jewish, 5.0% Muslim, 2.5% Buddhist, 2.1% Hindu, 18.3% none Median income: $36,400 (2020) Average income: $50,440 (2020)
Geography
York Centre consists of the part of the City of Toronto bounded on the north by the northern city limit, and on the east, south and west by a line drawn from the city limit south along Bathurst Street, southeast along the Don River West Branch, southwest and west along Highway 401, north along Jane Street, east along Sheppard Avenue West, northwest along Black Creek, east along Grandravine Drive, and north along Keele Street to the city limit.
York Centre was originally created in 1903 from parts of York East and York Westridings. It was created when the county of York (excluding the city of Toronto) was divided into three ridings: York Centre, York North and York South. The centre riding consisted of the townships of Etobicoke, Markham, Scarborough and Vaughan, and the villages of Markham, Richmond Hill, Weston and Woodbridge. The electoral district was abolished in 1914 when it was redistributed between York East, York South and York West. In 1952, York Centre was re-established with parts of Eglinton—Lawrence, Willowdale, York North and York West ridings.
The new riding consisted initially of the part of the township of North York west of Yonge Street, the part of the township of Vaughan south of Highway Number 7, and the town of Woodbridge.
In 1966, it was redefined to consist of the part of Metropolitan Toronto bounded on the north by the northern limit, and on the west, south and east by a line drawn from that borough limit south along Highway 400, east along Sheppard Avenue West, south along Jane Street, southeast along Exbury Road, east along Calvington Drive, south along Keele Street, east along Highway 401, south along the Canadian National Railway line, east along Lawrence Avenue West, north along the Spadina Expressway, northeast along Highway 401, north along Bathurst Street, east along Sheppard Avenue West, south along Easton Street, east along Cameron Avenue, and north along Yonge Street to the Metro Toronto limit. It is unclear why the name York Centre was retained as the district was now predominantly in the Borough of North York rather than in the Region of York.
In 1976, it was redefined to consist of the part of the Borough of North York bounded on the north by the borough limit, and on the west, south and east by a line drawn from the borough limit south along Highway 400, east along Sheppard Avenue West, south along Keele Street, east along Highway 401, north along Bathurst Street, and northwest along the West Branch of the Don River to the borough limit.
In 1987, it was redefined to consist of the part of the City of North York bounded on the north by the city limit, and on the east, south and west by a line drawn from the city limit southeast along the Don River West Branch, west along Highway 401, north along Jane Street, east along Grandravine Drive, and north along Black Creek to the northern city limit.
In 1996, it was redefined to consist of the part of the City of North York bounded on the north by the city limit, and on the east, south and west by a line drawn from the city limit south along Dufferin Street, west along Sheppard Avenue West, north along Keele Street, west along Grandravine Drive, south along Jane Street, east along Highway 401, northwest along the Don River West Branch, north along Bathurst Street, east along Drewry Avenue, north along Chelmsford Avenue, west along Greenwin Village Road, and north along Village Gate to the city limit.
In 2003, it was given its current boundaries as described above.

.gif)
 1966 to 1976
 1976 to 1987
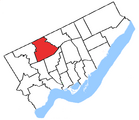 1987 to 1996
 1996 to 2003
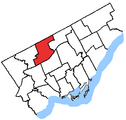 2003 to 2015


