Sainte-Soulle
You can help expand this article with text translated from the corresponding article in French. (December 2008) Click [show] for important translation instructions.
|
Sainte-Soulle | |
|---|---|
 The church in Sainte-Soulle | |
| Coordinates: 46°11′13″N 1°00′38″W / 46.187°N 1.0106°W | |
| Country | France |
| Region | Nouvelle-Aquitaine |
| Department | Charente-Maritime |
| Arrondissement | La Rochelle |
| Canton | La Jarrie |
| Intercommunality | CA La Rochelle |
| Government | |
| • Mayor (2020–2026) | Bertrand Ayral[1] |
| Area 1 | 21.82 km2 (8.42 sq mi) |
| Population (2021)[2] | 4,961 |
| • Density | 230/km2 (590/sq mi) |
| Time zone | UTC+01:00 (CET) |
| • Summer (DST) | UTC+02:00 (CEST) |
| INSEE/Postal code | 17407 /17220 |
| Elevation | 3–42 m (9.8–137.8 ft) (avg. 32 m or 105 ft) |
| 1 French Land Register data, which excludes lakes, ponds, glaciers > 1 km2 (0.386 sq mi or 247 acres) and river estuaries. | |
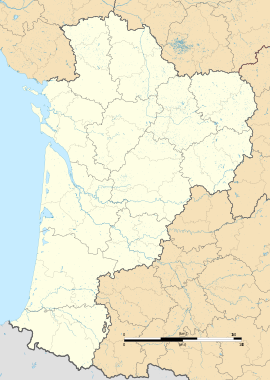
Sainte-Soulle (French pronunciation: [sɛ̃t sul]) is a commune in the Charente-Maritime department in the Nouvelle-Aquitaine region in southwestern France.
Geography
The commune is situated about 12 km (7.5 mi) east of La Rochelle and forms a part of the metropolitan area of La Rochelle.
It is traversed by the N11 (La Rochelle - Paris), which can be accessed at the Usseau roundabout. At the Usseau roundabout, the route connecting La Rochelle with Nantes (N137) branches off the N11. The future highway A831 (Fontenay-le-Comte—Rochefort) will pass through the commune.
Apart from the village Sainte-Soulle, the commune consists of the localities Les Grandes-Rivières, Les Petites-Rivières, Saint-Coux, part of Fontpatour, le Treuil-Arnaudeau, Usseau, La Gabardelière, Chavagne and Le Raguenaud.
Formerly an agricultural commune, it became urbanized in the 1990s and many of its residents are now employed in nearby La Rochelle.
History
The name of the commune comes from the local saint Soline (see also the commune of Sainte-Soline in the Deux-Sèvres department).
Population
| Year | Pop. | ±% p.a. |
|---|---|---|
| 1968 | 1,386 | — |
| 1975 | 1,918 | +4.75% |
| 1982 | 2,221 | +2.12% |
| 1990 | 2,603 | +2.00% |
| 1999 | 2,653 | +0.21% |
| 2007 | 3,351 | +2.96% |
| 2012 | 3,740 | +2.22% |
| 2017 | 4,533 | +3.92% |
| Source: INSEE[3] | ||
See also
References
- ^ "Répertoire national des élus: les maires". data.gouv.fr, Plateforme ouverte des données publiques françaises (in French). 9 August 2021.
- ^ "Populations légales 2021". The National Institute of Statistics and Economic Studies. 28 December 2023.
- ^ Population en historique depuis 1968, INSEE
External links
 Media related to Sainte-Soulle at Wikimedia Commons
- CS1 French-language sources (fr)
- Use dmy dates from August 2023
- Geography articles needing translation from French Wikipedia
- Articles with short description
- Short description is different from Wikidata
- Coordinates on Wikidata
- Pages using infobox settlement with image map1 but not image map
- Pages with French IPA
- Commons category link from Wikidata
- Articles with BNF identifiers
- Articles with BNFdata identifiers
- Communes of Charente-Maritime
- Charente-Maritime communes articles needing translation from French Wikipedia
- All stub articles
- Charente-Maritime geography stubs
- Pages using the Kartographer extension


