Northampton Borough Council elections
Northampton Borough Council was the local authority for Northampton in Northamptonshire, England and was elected every four years. From the last boundary changes in 1999, 47 councillors were elected from 23 wards.[1] The borough council was abolished in 2021, with the area becoming part of West Northamptonshire.
Political control
From the first election to the council in 1973 until its abolition in 2021, political control of the council was held by the following parties:[2]
| Party in control | Years | |
|---|---|---|
| Labour | 1973–1976 | |
| Conservative | 1976–1983 | |
| No overall control | 1983–1987 | |
| Conservative | 1987–1991 | |
| No overall control | 1991–1995 | |
| Labour | 1995–2003 | |
| No overall control | 2003–2007 | |
| Liberal Democrats | 2007–2011 | |
| Conservative | 2011–2021 | |
Leadership
The mayor of Northampton was the ceremonial figurehead for the borough council, and tended to be held by a different person each year. Political leadership was provided instead by the leader of the council. The leaders from 2002 until the council's abolition in 2021 were:[3]
| Councillor | Party | From | To | |
|---|---|---|---|---|
| Keith Davies | Labour | 4 May 2003 | ||
| Phil Larratt | Conservative | 22 May 2003 | Jan 2006 | |
| Tim Hadland | Conservative | 23 Jan 2006 | 24 May 2007 | |
| Tony Woods | Liberal Democrats | 24 May 2007 | 26 Oct 2009 | |
| Brian Hoare | Liberal Democrats | 26 Oct 2009 | 8 May 2011 | |
| David Palethorpe | Conservative | 19 May 2011 | Nov 2011 | |
| David Mackintosh | Conservative | 7 Nov 2011 | 10 May 2015 | |
| Mary Markham[4] | Conservative | 21 May 2015 | 17 Oct 2016 | |
| Jonathan Nunn | Conservative | 7 Nov 2016 | 31 Mar 2021 | |
Jonathan Nunn subsequently became the first leader of the replacement West Northamptonshire Council.
Council elections
- 1973 Northampton Borough Council election
- 1976 Northampton Borough Council election
- 1979 Northampton Borough Council election (New ward boundaries)[5]
- 1983 Northampton Borough Council election
- 1987 Northampton Borough Council election
- 1991 Northampton Borough Council election
- 1995 Northampton Borough Council election
- 1999 Northampton Borough Council election (New ward boundaries increased the number of seats by 4)[6][7]
- 2003 Northampton Borough Council election
- 2007 Northampton Borough Council election
- 2011 Northampton Borough Council election (New ward boundaries)[8]
- 2015 Northampton Borough Council election
Borough result maps
-
 1999 results map
 -
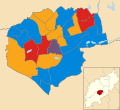 2003 results map
 -
 2007 results map
 -
 2011 results map
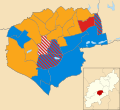
 -
 2015 results map


By-election results
1995-1999
| Party | Candidate | Votes | % | ±% | |
|---|---|---|---|---|---|
| Liberal Democrats | 1,435 | 38.5 | −4.4 | ||
| Labour | 1,235 | 33.1 | −2.2 | ||
| Conservative | 1,059 | 28.4 | +6.6 | ||
| Majority | 200 | 5.4 | |||
| Turnout | 3,729 | ||||
| Liberal Democrats hold | Swing | ||||
| Party | Candidate | Votes | % | ±% | |
|---|---|---|---|---|---|
| Labour | 1,867 | 58.6 | −17.1 | ||
| Conservative | 841 | 26.4 | +10.3 | ||
| Liberal Democrats | 407 | 12.8 | +4.5 | ||
| UKIP | 71 | 2.2 | +2.2 | ||
| Majority | 1,026 | 32.2 | |||
| Turnout | 3,186 | ||||
| Labour hold | Swing | ||||
| Party | Candidate | Votes | % | ±% | |
|---|---|---|---|---|---|
| Labour | 1,662 | 46.1 | −16.4 | ||
| Conservative | 1,307 | 36.2 | +9.3 | ||
| Liberal Democrats | 640 | 17.7 | +7.0 | ||
| Majority | 355 | 9.9 | |||
| Turnout | 3,609 | ||||
| Labour hold | Swing | ||||
| Party | Candidate | Votes | % | ±% | |
|---|---|---|---|---|---|
| Labour | 551 | 65.9 | −3.5 | ||
| Liberal Democrats | 113 | 13.5 | −7.5 | ||
| Conservative | 96 | 11.5 | +1.9 | ||
| Green | 45 | 5.4 | +5.4 | ||
| Independent | 31 | 3.7 | +3.7 | ||
| Majority | 438 | 52.4 | |||
| Turnout | 836 | 16.7 | |||
| Labour hold | Swing | ||||
2003-2007
| Party | Candidate | Votes | % | ±% | |
|---|---|---|---|---|---|
| Liberal Democrats | Roger Conroy | 635 | 42.2 | +16.7 | |
| Labour | Alan Scott | 546 | 36.3 | −7.2 | |
| Conservative | Laura Norman | 265 | 17.6 | −13.4 | |
| Green | Marcus Rock | 33 | 2.2 | +2.2 | |
| CPA | Antony Solomon | 25 | 1.7 | +1.7 | |
| Majority | 89 | 5.9 | |||
| Turnout | 1,504 | 28.5 | |||
| Liberal Democrats gain from Labour | Swing | ||||
2007-2011
| Party | Candidate | Votes | % | ±% | |
|---|---|---|---|---|---|
| Conservative | Matthew Golby | 1,072 | 53.0 | +9.7 | |
| Labour | Geoff Howes | 322 | 15.9 | −1.3 | |
| Independent | David Huffadine-Smith | 320 | 15.8 | −3.8 | |
| Liberal Democrats | Marion Allen-Minney | 307 | 15.2 | +7.0 | |
| Majority | 750 | 37.1 | |||
| Turnout | 2,021 | 32.2 | |||
| Conservative hold | Swing | ||||
2015-2021
| Party | Candidate | Votes | % | ±% | |
|---|---|---|---|---|---|
| Liberal Democrats | Brian Markham | 583 | 49.7 | +36.4 | |
| Conservative | Gregory Lunn | 319 | 27.2 | −28.7 | |
| Labour | Toby Birch | 270 | 23.0 | −7.6 | |
| Majority | 264 | 23.4 | |||
| Turnout | 1127 | 33 | |||
| Liberal Democrats gain from Conservative | Swing | ||||
| Party | Candidate | Votes | % | ±% | |
|---|---|---|---|---|---|
| Labour | Paul Joyce | 493 | 50.5 | +13.5 | |
| Conservative | Pauline Woodhouse | 288 | 29.5 | −4.1 | |
| Liberal Democrats | Martin Sawyer | 195 | 20.0 | +16.7 | |
| Majority | 205 | 20.9 | |||
| Turnout | 980 | 27 | |||
| Labour hold | Swing | ||||
| Party | Candidate | Votes | % | ±% | |
|---|---|---|---|---|---|
| Conservative | Luke Graystone | 803 | 52.5 | +11.7 | |
| Labour | Nikesh Jani | 343 | 22.4 | +7.6 | |
| Liberal Democrats | Brian Hoare | 293 | 19.2 | +9.0 | |
| Green | Denise Donaldson | 91 | 5.9 | +5.9 | |
| Majority | |||||
| Turnout | 1530 | 18.2 | |||
| Conservative hold | Swing | ||||
| Party | Candidate | Votes | % | ±% | |
|---|---|---|---|---|---|
| Labour | Emma Roberts | 914 | 43.4 | +15.6 | |
| Conservative | Daniel Soan | 549 | 26.0 | +1.3 | |
| Independent | Nicola McKenna | 417 | 19.8 | +19.8 | |
| Liberal Democrats | Michael Maher | 133 | 6.3 | −10.4 | |
| Green | Denise Donaldson | 95 | 4.5 | +4.5 | |
| Majority | 365 | 17.3 | |||
| Turnout | 2,108 | ||||
| Labour hold | Swing | ||||
References
- ^ "Borough Council Elections". Northampton Borough Council. Archived from the original on 10 May 2011. Retrieved 15 September 2009.
- ^ "Northampton". BBC News Online. Retrieved 15 September 2009.
- ^ "Council minutes". Northampton Borough Council. Retrieved 20 June 2022.
- ^ "Leader of Northampton Borough Council to resign". Northampton Chronicle and Echo. 15 October 2016. Retrieved 20 June 2022.
- ^ The Borough of Northampton (Electoral Arrangements) Order 1978
- ^ "Northampton". BBC News Online. Retrieved 15 September 2009.
- ^ legislation.gov.uk - The Borough of Northampton (Electoral Changes) Order 1998. Retrieved on 4 October 2015.
- ^ legislation.gov.uk - The Northampton (Electoral Changes) Order 2011. Retrieved on 3 November 2015.
- ^ "Lib Dems triumph in council byelection". guardian.co.uk. 10 February 2006. Retrieved 15 September 2009.
- ^ "Tories hold Duston in by-election". Northampton Chronicle & Echo. 23 January 2009. Retrieved 15 September 2009.
- ^ "Declaration of Result of Poll - Westone". www.northampton.gov.uk. Northampton Borough Council. Retrieved 10 December 2016.
- ^ "Local Elections Archive Project — Delapre and Briar Hill Ward". www.andrewteale.me.uk. Retrieved 18 February 2024.