| Year | Pop. | ±% |
|---|
| 1536 | 250 | — |
|---|
| 1614 | 26,400 | +10460.0% |
|---|
| 1791 | 56,600 | +114.4% |
|---|
| 1812 | 63,900 | +12.9% |
|---|
| 1820 | 64,000 | +0.2% |
|---|
| 1827 | 60,000 | −6.2% |
|---|
| 1839 | 55,100 | −8.2% |
|---|
| 1850 | 80,000 | +45.2% |
|---|
| 1861 | 100,000 | +25.0% |
|---|
| 1877 | 101,500 | +1.5% |
|---|
| | Year | Pop. | ±% |
|---|
| 1890 | 103,900 | +2.4% |
|---|
| 1896 | 113,000 | +8.8% |
|---|
| 1900 | 103,900 | −8.1% |
|---|
| 1908[1] | 154,617 | +48.8% |
|---|
| 1920[1] | 203,381 | +31.5% |
|---|
| 1925 | 260,000 | +27.8% |
|---|
| 1927 | 200,000 | −23.1% |
|---|
| 1931 | 373,900 | +86.9% |
|---|
| 1940 | 533,600 | +42.7% |
|---|
| 1945 | 657,800 | +23.3% |
|---|
| | Year | Pop. | ±% |
|---|
| 1951 | 835,000 | +26.9% |
|---|
| 1953 | 964,000 | +15.4% |
|---|
| 1961 | 1,262,100 | +30.9% |
|---|
| 1969 | 2,541,300 | +101.4% |
|---|
| 1981 | 3,573,227 | +40.6% |
|---|
| 1993 | 5,363,270 | +50.1% |
|---|
| 1997 | 5,930,318 | +10.6% |
|---|
| 2000 | 6,271,430 | +5.8% |
|---|
| 2007 | 7,819,436 | +24.7% |
|---|
|
 1535
1535 1750
1750 1910
1910 1940
1940 1970
1970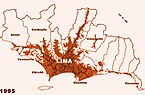 1995
1995


