2025 Portuguese local elections
| |||||||||||||||||||||
All 308 Portuguese municipalities and 3,000+[1] Portuguese Parishes All 2,000+ local government councillors | |||||||||||||||||||||
|---|---|---|---|---|---|---|---|---|---|---|---|---|---|---|---|---|---|---|---|---|---|
| Opinion polls | |||||||||||||||||||||
| |||||||||||||||||||||
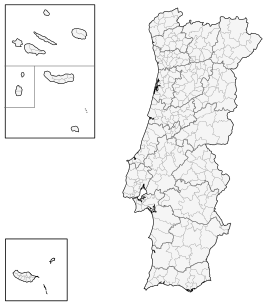
The Portuguese local election of 2025 will take place on late September or early October of the same year. The election consistes of three separate elections in the 308 Portuguese municipalities, the election for the Municipal Chambers, whose winner is elected mayor, another election for the Municipal Assembly, as well an election for the lower-level Parish Assembly, whose winner is elected parish president. This last will be held separately in the more than 3,000 parishes around the country.
In this election, 42.9% of incumbent mayors, 132 to be precise, will be barred from running for another term: 63 from the PS, 47 from the PSD, 13 from CDU, 6 Independents and 3 from the CDS–PP.[2] The number of parishes up for election could also grow from the current 3,092 because of changes in the 2013 local reform law that will allow the separation of merged parishes.[3]
Background
Date
According to the local election law, an election must be called between 22 September and 14 October of the year that the local mandates end. The election is called by a Government of Portugal decree, unlike general elections which are called by the President of the Republic. The Election date must be announced at least 80 days before election day. Election day is the same in all municipalities, and should fall on a Sunday or national holiday. The 2025 local elections should, therefore, take place no later than 12 October 2025.[4]
Electoral system

All 308 municipalities are allocated a certain number of councilors to elect corresponding to the number of registered voters in a given municipality. Each party or coalition must present a list of candidates. The lists are closed and the seats in each municipality are apportioned according to the D'Hondt method. Unlike in national legislative elections, independent lists are allowed to run.
Council seats and Parish assembly seats are distributed as follows:
| Councilors | Parish Assembly | ||
|---|---|---|---|
| Seats | Voters | Seats | Voters |
| 17 | only Lisbon | 19+a | more than 30,000 voters |
| 13 | only Porto | 19 | more than 20,000 voters |
| 11 | 100,000 voters or more | 13 | more than 5,000 voters |
| 9 | more than 50,000 voters | 9 | more than 1,000 voters |
| 7 | more than 10,000 voters | 7 | 1,000 voters or less |
| 5 | 10,000 voters or less | ||
a For parishes with more than 30,000 voters, the number of seats mentioned above is increased by one per every 10,000 voters in excess of that number, and then by one more if the result is even.
Parties
The main political forces that will be involved in the election are:
- Left Bloc (BE)
- Democratic and Social Centre–People's Party (CDS–PP) (only in some municipalities)1
- Unitary Democratic Coalition (CDU)
- Enough (CH)
- Together for the People (JPP)
- Liberal Initiative (IL)
- People–Animals–Nature (PAN)
- Socialist Party (PS)
- Social Democratic Party (PSD) (only in some municipalities)1
1 The PSD and the CDS–PP are expected to form coalitions in several municipalities between them and with some smaller center-right/right-wing parties like the Earth Party (MPT) and the People's Monarchist Party (PPM).
Opinion polls
Current City control
The following table lists the current party control in all district capitals, as well as in municipalities above 100,000 inhabitants. Population estimates from 2022.[6]
See also
References
- ^ DGAI - Reorganização Administrativa do Território das Freguesias - (RATF)
- ^ "Autárquicas: renovação por limite de mandato foi de 44%". www.expresso.pt/ (in Portuguese). Expresso. 3 October 2021. Retrieved 16 July 2023.
- ^ "Pelo menos 185 freguesias pediram ao parlamento para se desagregarem". www.dn.pt/ (in Portuguese). Diário de Notícias. 23 December 2022. Retrieved 11 July 2023.
- ^ "Lei Eleitoral dos Orgãos das Autarquias Locais" (PDF). Comissão Nacional de Eleições (in Portuguese): 57. 2020.
- ^ "AUTARQUIAS LOCAIS - COMPETÊNCIAS E REGIME JURÍDICO". Procuradoria-Geral Distrital de Lisboa (in Portuguese). 2018.
- ^ "População residente (N.º) por Local de residência (NUTS - 2013), Sexo e Grupo etário (Por ciclos de vida); Anual". www.ine.pt (in Portuguese). Statistics Portugal. Retrieved 11 July 2023.


