File:US States by Incarceration Rate.svg

Original file (SVG file, nominally 959 × 593 pixels, file size: 61 KB)
This file is translated using SVG <switch> elements. All translations are stored in the same file! Learn more.
For most Wikipedia projects, you can embed the file normally (without a To translate the text into your language, you can use the SVG Translate tool. Alternatively, you can download the file to your computer, add your translations using whatever software you're familiar with, and re-upload it with the same name. You will find help in Graphics Lab if you're not sure how to do this. |
Summary
| Description |
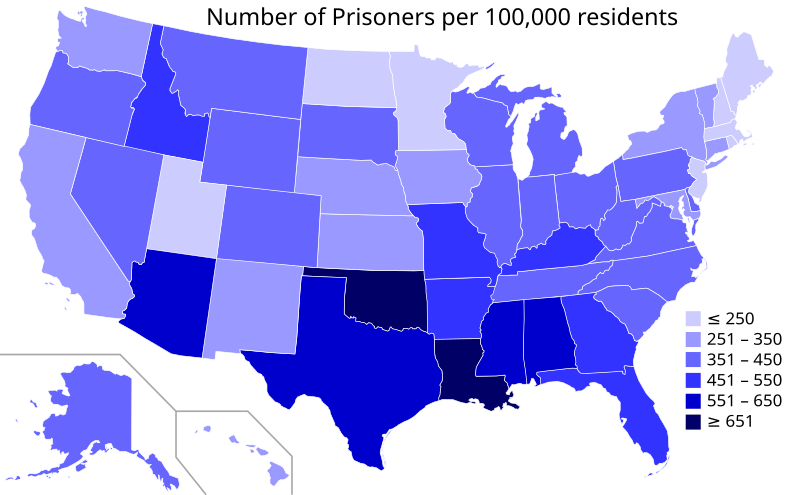
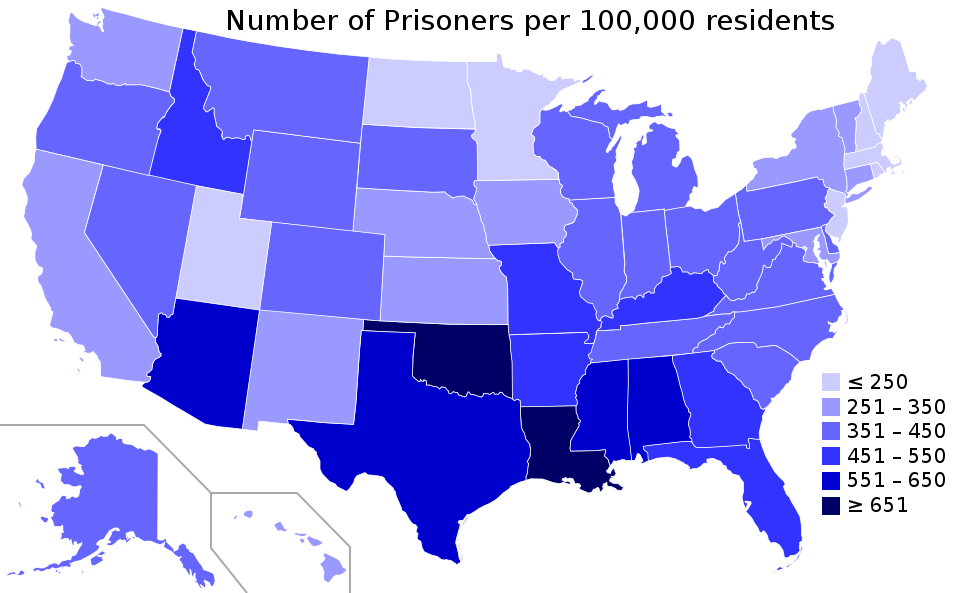
English: A visual representation of states in the United States by the rate of incarceration per 100,000 U.S. residents (all ages) under the jurisdiction of state prison correctional authorities on December 31, 2014. The data used for the map does not include inmates in jails or federal prisons. Data is from Prisoners in 2014 NCJ 248955 p14t06.csv and p14t02.csv. See table 6 on page 8 of the PDF. It lists the rates by state. It also lists the federal imprisonment rate of 60 per 100,000 U.S. residents of all ages. That federal rate can be added to the state rate to get the combined state and federal prison rate. Table 6 also lists the number of state prison inmates for each state. Table 1 on page 2 of the PDF has the total number of federal inmates (210,567). See also: List of U.S. states by incarceration rate. |
| Date | - date of the first version of this map. |
| Source | Own work |
| Author | Spaceboyjosh |
| Other versions | Derivative works of this file: Количество заключённых в США (2011).png |
.png)

|
This file may be updated to reflect new information. If you wish to use a specific version of the file without new updates being mirrored, please upload the required version as a separate file. |
State prison rates and counts. The federal prison rate of 60 has not been added to the state prison rates in the table below.
| State | Rate per 100,000 population of all ages |
Total | Male | Female |
|---|---|---|---|---|
| Federal | 60 | 210,567 | 196,568 | 13,999 |
| State | 412 | 1,350,958 | 1,251,996 | 98,962 |
| Total | 471 | 1,561,525 | 1,448,564 | 112,961 |
| Alabama | 633 | 31,771 | 29,182 | 2,589 |
| Alaska | 374 | 5,216 | 4,568 | 648 |
| Arizona | 593 | 42,259 | 38,295 | 3,964 |
| Arkansas | 599 | 17,874 | 16,476 | 1,398 |
| California | 349 | 136,088 | 129,706 | 6,382 |
| Colorado | 383 | 20,646 | 18,738 | 1,908 |
| Connecticut | 326 | 16,636 | 15,510 | 1,126 |
| Delaware | 440 | 6,955 | 6,361 | 594 |
| Florida | 513 | 102,870 | 95,567 | 7,303 |
| Georgia | 517 | 52,949 | 49,438 | 3,511 |
| Hawaii | 257 | 5,866 | 5,198 | 668 |
| Idaho | 489 | 8,117 | 7,080 | 1,037 |
| Illinois | 375 | 48,278 | 45,390 | 2,888 |
| Indiana | 442 | 29,271 | 26,396 | 2,875 |
| Iowa | 282 | 8,838 | 8,086 | 752 |
| Kansas | 322 | 9,663 | 8,881 | 782 |
| Kentucky | 474 | 21,657 | 19,084 | 2,573 |
| Louisiana | 816 | 38,030 | 35,955 | 2,075 |
| Maine | 153 | 2,242 | 2,063 | 179 |
| Maryland | 346 | 21,011 | 20,100 | 911 |
| Massachusetts | 188 | 10,713 | 9,985 | 728 |
| Michigan | 437 | 43,390 | 41,267 | 2,123 |
| Minnesota | 194 | 10,637 | 9,901 | 736 |
| Mississippi | 597 | 18,793 | 17,448 | 1,345 |
| Missouri | 526 | 31,942 | 28,836 | 3,106 |
| Montana | 360 | 3,699 | 3,311 | 388 |
| Nebraska | 283 | 5,441 | 5,001 | 440 |
| Nevada | 434 | 12,537 | 11,452 | 1,085 |
| New Hampshire | 219 | 2,963 | 2,715 | 248 |
| New Jersey | 241 | 21,590 | 20,571 | 1,019 |
| New Mexico | 329 | 7,021 | 6,348 | 673 |
| New York | 265 | 52,518 | 50,192 | 2,326 |
| North Carolina | 358 | 37,096 | 34,455 | 2,641 |
| North Dakota | 214 | 1,718 | 1,514 | 204 |
| Ohio | 444 | 51,519 | 47,311 | 4,208 |
| Oklahoma | 700 | 27,650 | 24,799 | 2,851 |
| Oregon | 378 | 15,075 | 13,799 | 1,276 |
| Pennsylvania | 394 | 50,694 | 47,936 | 2,758 |
| Rhode Island | 178 | 3,359 | 3,201 | 158 |
| South Carolina | 429 | 21,401 | 20,032 | 1,369 |
| South Dakota | 421 | 3,608 | 3,199 | 409 |
| Tennessee | 437 | 28,769 | 26,160 | 2,609 |
| Texas | 584 | 166,043 | 151,717 | 14,326 |
| Utah | 237 | 7,026 | 6,364 | 662 |
| Vermont | 241 | 1,979 | 1,823 | 156 |
| Virginia | 449 | 37,544 | 34,529 | 3,015 |
| Washington | 254 | 18,120 | 16,666 | 1,454 |
| West Virginia | 372 | 6,896 | 6,065 | 831 |
| Wisconsin | 371 | 22,597 | 21,219 | 1,378 |
| Wyoming | 408 | 2,383 | 2,106 | 277 |
Licensing
- You are free:
- to share – to copy, distribute and transmit the work
- to remix – to adapt the work
- Under the following conditions:
- attribution – You must give appropriate credit, provide a link to the license, and indicate if changes were made. You may do so in any reasonable manner, but not in any way that suggests the licensor endorses you or your use.
- share alike – If you remix, transform, or build upon the material, you must distribute your contributions under the same or compatible license as the original.
File history
Click on a date/time to view the file as it appeared at that time.
| Date/Time | Thumbnail | Dimensions | User | Comment | |
|---|---|---|---|---|---|
| current | 18:07, 8 November 2015 | | 959 × 593 (61 KB) | commons>Delphi234 | 2014 |
File usage
There are no pages that use this file.