File:Tax revenue as a percentage of GDP (1985-2014).png
Jump to navigation
Jump to search
Size of this preview: 800 × 502 pixels. Other resolutions: 320 × 201 pixels | 640 × 402 pixels | 1,081 × 679 pixels.
Original file (1,081 × 679 pixels, file size: 111 KB, MIME type: image/png)
.png)
File history
Click on a date/time to view the file as it appeared at that time.
| Date/Time | Thumbnail | Dimensions | User | Comment | |
|---|---|---|---|---|---|
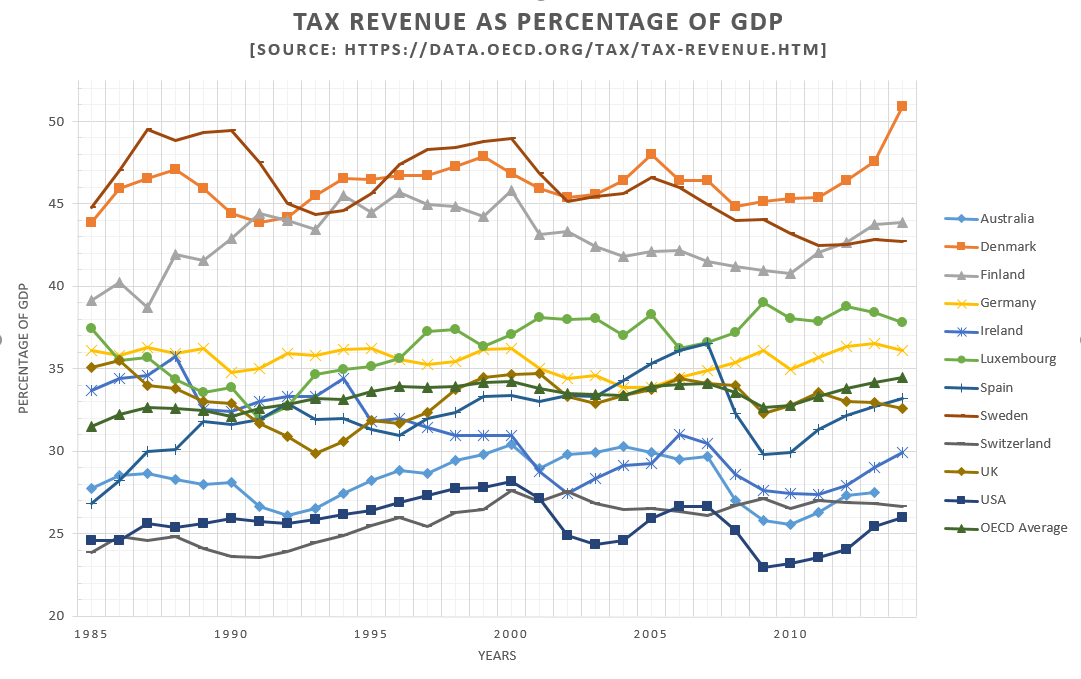
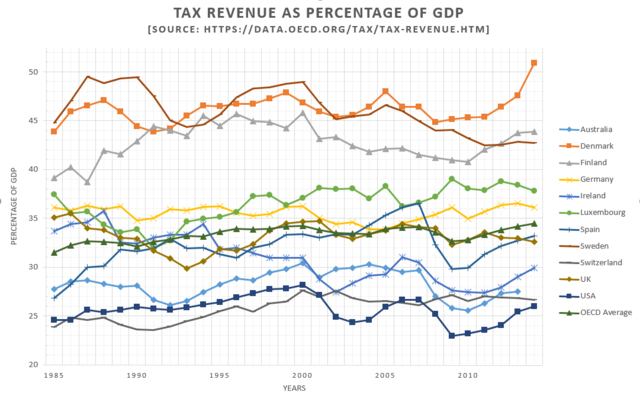
| current | 20:05, 25 February 2016 | | 1,081 × 679 (111 KB) | commons>Ranníocóir | {{subst:Upload marker added by en.wp UW}} {{Information |Description = {{en|This image shows a graph of tax revenue as a percentage of GDP for ten states and the OECD average for the years 1985-2014 (Australia 1985-2013). The countries included are Aus... |
File usage
There are no pages that use this file.
.png)