File:Population graph for Norway.svg
Jump to navigation
Jump to search

Size of this PNG preview of this SVG file: 354 × 219 pixels. Other resolutions: 320 × 198 pixels | 640 × 396 pixels | 1,024 × 633 pixels | 1,280 × 792 pixels | 2,560 × 1,584 pixels.
Original file (SVG file, nominally 354 × 219 pixels, file size: 41 KB)
Summary
| Description |
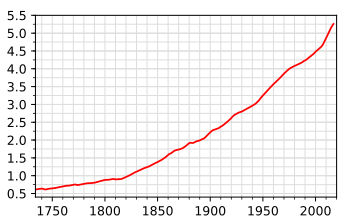
English: Norway's population (1735–2017). In millions. |
| Date | |
| Source | Own work, plotted using Matplotlib (Source code available). Data from Statistics Norway: Table 05803. Note: Figures for 1735-1815 and 1838 are taken from Michael Drake: Population and Society in Norway 1735-1865. Before 1816 estimated mean population. |
| Author | Danmichaelo |

|
This file may be updated to reflect new information. If you wish to use a specific version of the file without new updates being mirrored, please upload the required version as a separate file. |
Licensing
| I, the copyright holder of this work, release this work into the public domain. This applies worldwide. In some countries this may not be legally possible; if so: I grant anyone the right to use this work for any purpose, without any conditions, unless such conditions are required by law. |
File history
Click on a date/time to view the file as it appeared at that time.
| Date/Time | Thumbnail | Dimensions | User | Comment | |
|---|---|---|---|---|---|
| current | 07:47, 20 July 2017 | | 354 × 219 (41 KB) | commons>Danmichaelo | Update y scale to give some space at the top |
File usage
There are no pages that use this file.