File:Ombrothermic diagram of Amiens.png
Jump to navigation
Jump to search

Size of this preview: 800 × 382 pixels. Other resolutions: 320 × 153 pixels | 640 × 305 pixels | 1,024 × 488 pixels | 1,786 × 852 pixels.
Original file (1,786 × 852 pixels, file size: 185 KB, MIME type: image/png)
Summary
| Description |
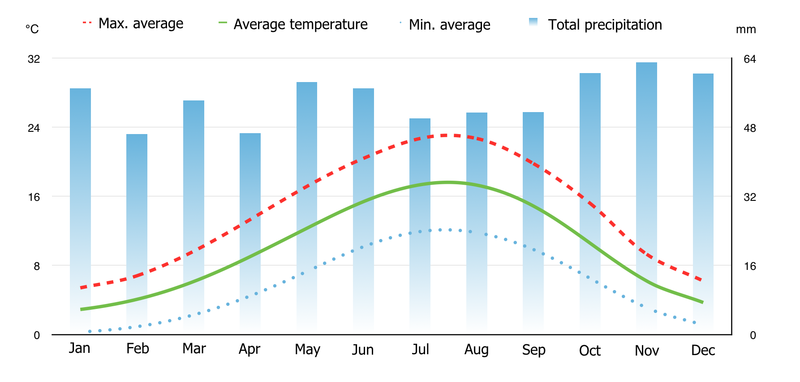
English: Diagram showing the evolution of the average low, high and global temperatures of Amiens, as well as the precipitation bars.
Averages calculated from the last 15 years of collected data from the station of Beauvais and Albert (data available on the "infoclimat" website |
| Date |
|
| Source |
|
| Author |
|
Licensing
I, the copyright holder of this work, hereby publish it under the following license:
This file is licensed under the Creative Commons Attribution-Share Alike 4.0 International license.
- You are free:
- to share – to copy, distribute and transmit the work
- to remix – to adapt the work
- Under the following conditions:
- attribution – You must give appropriate credit, provide a link to the license, and indicate if changes were made. You may do so in any reasonable manner, but not in any way that suggests the licensor endorses you or your use.
- share alike – If you remix, transform, or build upon the material, you must distribute your contributions under the same or compatible license as the original.
File history
Click on a date/time to view the file as it appeared at that time.
| Date/Time | Thumbnail | Dimensions | User | Comment | |
|---|---|---|---|---|---|
| current | 12:50, 2 June 2015 | | 1,786 × 852 (185 KB) | commons>EP111 | {{Information |description={{en|1=Diagram showing the evolution of the average low, high and global temperatures of Amiens, as well as the precipitation bars. Averages calculated from the last 15 years of collected data from the station of Beauvais and... |
File usage
There are no pages that use this file.