File:Odds ratio minsig.svg
Jump to navigation
Jump to search

Size of this PNG preview of this SVG file: 720 × 540 pixels. Other resolutions: 320 × 240 pixels | 640 × 480 pixels | 1,024 × 768 pixels | 1,280 × 960 pixels | 2,560 × 1,920 pixels.
Original file (SVG file, nominally 720 × 540 pixels, file size: 41 KB)
Summary
| Description |
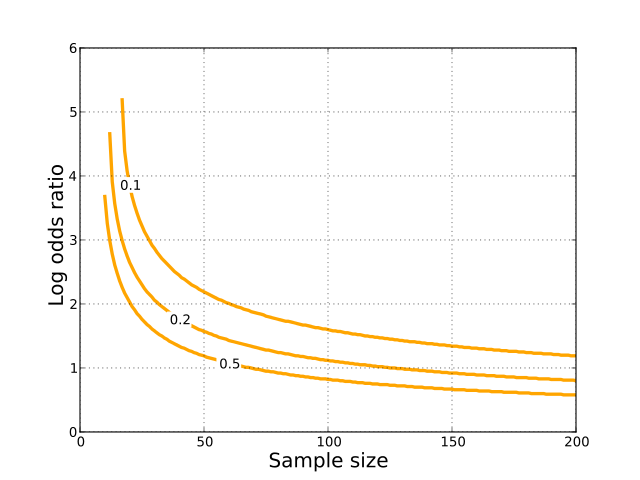
English: Graph showing the minimum value of the log odds ratio statistic that must be observed to be deemed significant at the 0.05 level, using the standard asymptotic hypothesis test. The three lines correspond to different values of the marginal probabilities in the 2x2 contingency table. The row and column marginal probabilities are held equal in this graph. |
||
| Date | |||
| Source | Own work | ||
| Author | Skbkekas | ||
| Permission (Reusing this file) |
I, the copyright holder of this work, hereby publish it under the following licenses: This file is licensed under the Creative Commons Attribution-Share Alike 3.0 Unported license.
You may select the license of your choice. |
||
| SVG development | This plot was created with Matplotlib. | ||
| Source code | Python codeimport numpy as np
import matplotlib.pyplot as plt
## Sample sizes.
N = np.arange(10,201)
## Grid of log odds ratio and odds ratio values.
LOR = np.linspace(0.01,20,2000)
R = np.exp(LOR)
## Where to position the line labels.
x = {0.1: 20, 0.2: 40, 0.5: 60}
plt.clf()
for p in 0.1,0.2,0.5:
## Get the cell probabilities corresponding to each odds ratio R.
S = np.sqrt((1+2*p*(R-1))**2 + 4*R*(1-R)*p**2)
P11 = (1 + 2*p*(R-1) - S) / (2*(R-1))
P10 = p-P11
P01 = P10
P00 = 1 - (P11+2*P10)
## The standard errors.
SE = np.sqrt(1/P11 + 1/P10 + 1/P01 + 1/P00)
## Figure out which odds ratio gives a significant result.
Q = []
for n in N:
ii = np.flatnonzero(LOR > 2*SE/np.sqrt(n))
if len(ii)>0:
Q.append([n,np.min(LOR[ii])])
Q = np.array(Q)
plt.plot(Q[:,0], Q[:,1], '-', color='orange', lw=3)
jj = np.argmin(np.abs(Q[:,0]-x[p]))
plt.text(x[p], Q[jj,1], "%.1f" % p, ha='center', va='center',\
backgroundcolor='white')
plt.ylabel("Log odds ratio", size=18)
plt.xlabel("Sample size", size=18)
plt.grid(True)
plt.savefig("odds_ratio_minsig.pdf")
plt.savefig("odds_ratio_minsig.svg")
|

File history
Click on a date/time to view the file as it appeared at that time.
| Date/Time | Thumbnail | Dimensions | User | Comment | |
|---|---|---|---|---|---|
| current | 15:39, 10 November 2010 | | 720 × 540 (41 KB) | commons>Skbkekas | Added a grid to make the graph easier to read. |
File usage
There are no pages that use this file.