File:Map of samples and population structure of North Africa and neighboring populations.png

From WikiProjectMed
Jump to navigation Jump to search

Original file(1,992 × 630 pixels, file size: 399 KB, MIME type: image/png)

This file is from a shared repository and may be used by other projects. The description on its file description page there is shown below.

Description
English: Map of samples and population structure of North Africa and neighboring populations. A) On the map, star symbols indicate the location of new population samples and circles indicate previously published samples. The decreasing proportions of Maghrebi ancestry is indicated in a west-to-east gradient of blue across North Africa. An unsupervised clustering algorithm, ADMIXTURE [1] was used to analyze population structure among 13 African, 2 European and 1 Near Eastern populations based on approximately 300 K autosomal SNP loci in common. The two main gradients of ancestry in North Africa (at k = 8), Maghrebi and Near Eastern, are emphasized with arrows. Other population colors in open circles match the colors displayed in the population structure analysis. B) We plot the full dataset assuming k = 2,4,6,8 ancestral populations. k = 10 and log likelihoods are presented in Figure_S1.
Date Published: January 12, 2012
Source Henn BM, Botigué LR, Gravel S, Wang W, Brisbin A, Byrnes JK, et al. (2012) Genomic Ancestry of North Africans Supports Back-to-Africa Migrations. PLoS Genet 8(1): e1002397. doi:10.1371/journal.pgen.1002397 http://journals.plos.org/plosgenetics/article?id=10.1371/journal.pgen.1002397
Author Brenna M. Henn , Laura R. Botigué , Simon Gravel, Wei Wang, Abra Brisbin, Jake K. Byrnes, Karima Fadhlaoui-Zid, Pierre A. Zalloua, Andres Moreno-Estrada, Jaume Bertranpetit, Carlos D. Bustamante , David Comas
Other versions
MDS plot
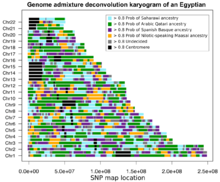
Genome admixture deconvolution of an Egyptian
ADMIXTURE results of North African and other populations
w:en:Creative Commons
attribution
This file is licensed under the Creative Commons Attribution 2.5 Generic license.
You are free:
  • to share – to copy, distribute and transmit the work
  • to remix – to adapt the work
Under the following conditions:
  • attribution – You must give appropriate credit, provide a link to the license, and indicate if changes were made. You may do so in any reasonable manner, but not in any way that suggests the licensor endorses you or your use.
PLOS
PLOS
This file was published in a Public Library of Science journal. Their website states that the content of all PLOS journals is published under the Creative Commons Attribution 4.0 license (or its previous version depending on the publication date), unless indicated otherwise.

Captions

Add a one-line explanation of what this file represents

Items portrayed in this file

depicts

image/png

File history

Click on a date/time to view the file as it appeared at that time.

Date/TimeThumbnailDimensionsUserComment
current20:19, 30 June 2016Thumbnail for version as of 20:19, 30 June 20161,992 × 630 (399 KB)commons>Was a bee{{Information |Description={{en|1= Map of samples and population structure of North Africa and neighboring populations. A) On the map, star symbols indicate the location of new population samples and circles indicate previously published samples. The d...

There are no pages that use this file.

Metadata