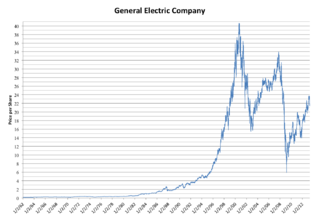
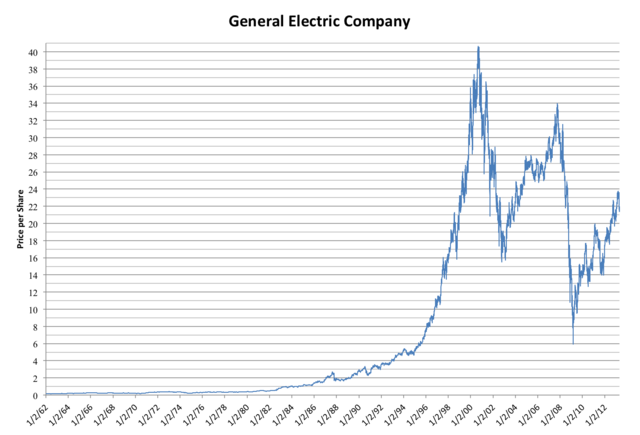
File:Linear GE Stock Price Graph 1962-2013.png
Jump to navigation
Jump to search

Size of this preview: 800 × 544 pixels. Other resolutions: 320 × 218 pixels | 640 × 435 pixels | 1,024 × 697 pixels | 1,408 × 958 pixels.
Original file (1,408 × 958 pixels, file size: 112 KB, MIME type: image/png)
File history
Click on a date/time to view the file as it appeared at that time.
| Date/Time | Thumbnail | Dimensions | User | Comment | |
|---|---|---|---|---|---|
| current | 17:39, 26 April 2013 | | 1,408 × 958 (112 KB) | commons>Jrinaldi97 | {{subst:Upload marker added by en.wp UW}} {{Information |Description = {{en|A linear stock price graph of GE from 1962 to 2013}} |Source = Used data from Yahoo and made graph with Excel |Date = 2013-04-26 |Author = Jrinaldi97 }} |
File usage
There are no pages that use this file.