File:India mumbai temperature precipitation averages chart.svg
Jump to navigation
Jump to search

Size of this PNG preview of this SVG file: 800 × 562 pixels. Other resolutions: 320 × 225 pixels | 640 × 450 pixels | 1,024 × 719 pixels | 1,280 × 899 pixels | 2,560 × 1,798 pixels.
Original file (SVG file, nominally 800 × 562 pixels, file size: 50 KB)
File history
Click on a date/time to view the file as it appeared at that time.
| Date/Time | Thumbnail | Dimensions | User | Comment | |
|---|---|---|---|---|---|
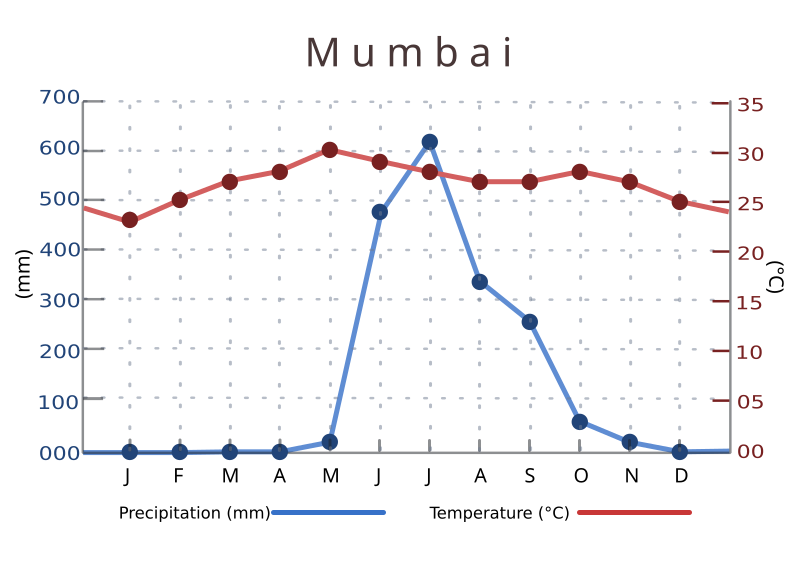
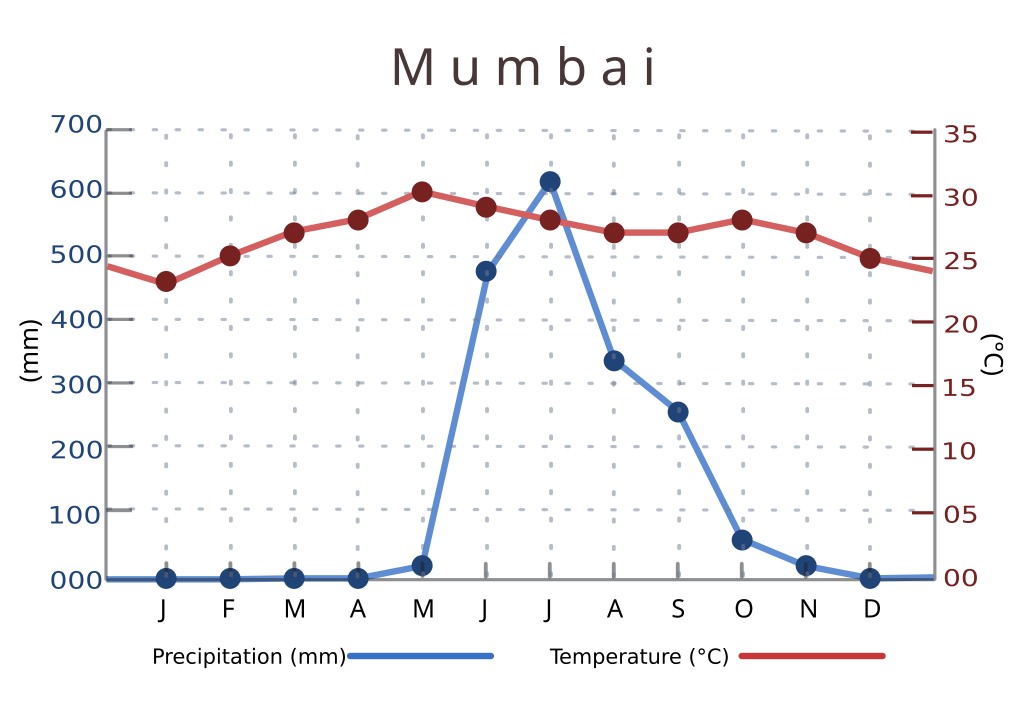
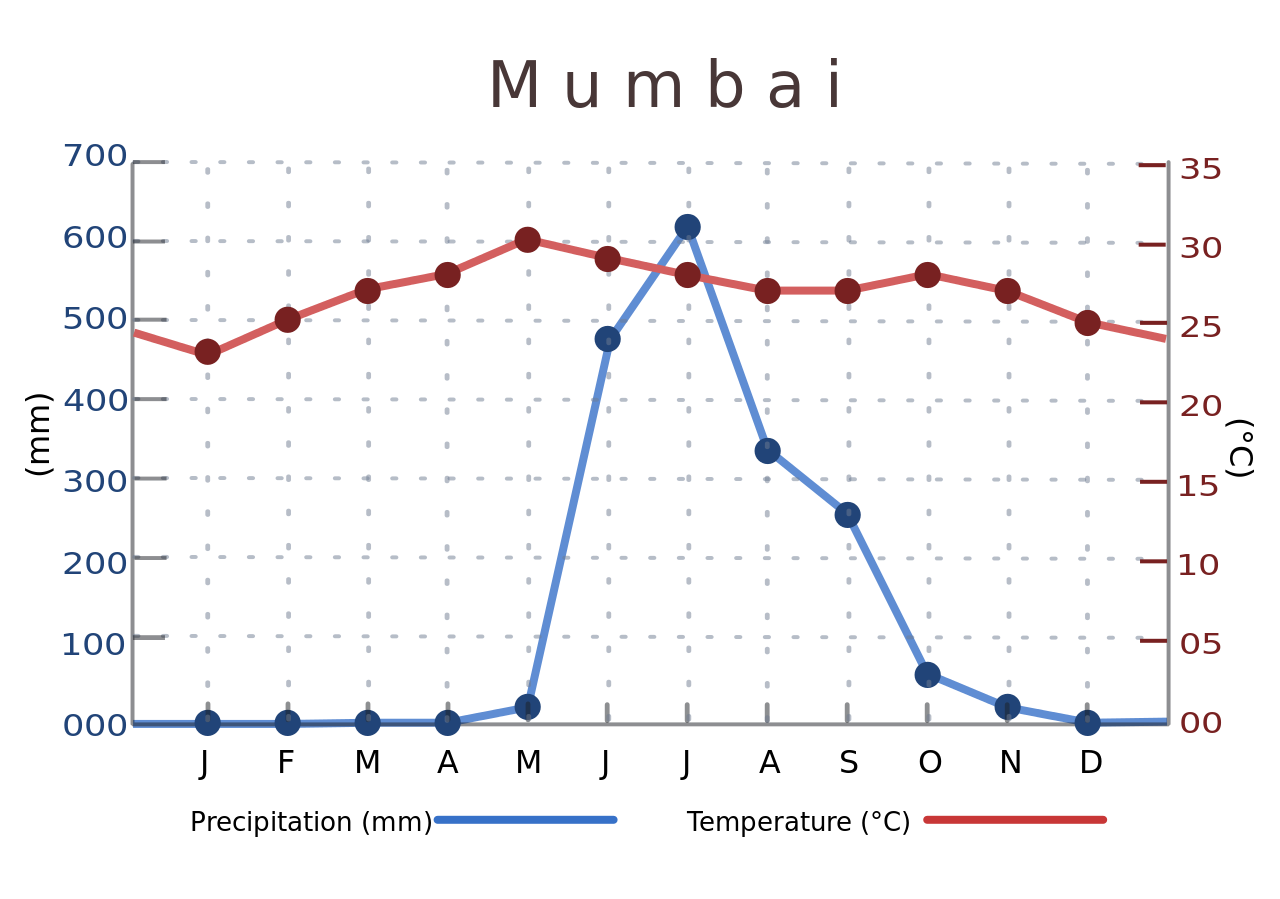
| current | 19:38, 1 April 2007 | | 800 × 562 (50 KB) | commons>Saravask | {{Information |Description=Chart showing historical averages of monthly precipitation and temperature in Mumbai, India |Source=Own work |Date=March 2007 |Author=Own work |Permission=See below |other_versions=None }} == Licensing == {{self|GFDL|cc-by-sa-2 |
File usage
There are no pages that use this file.