File:Implication graph.svg
Jump to navigation
Jump to search

Size of this PNG preview of this SVG file: 612 × 504 pixels. Other resolutions: 292 × 240 pixels | 583 × 480 pixels | 933 × 768 pixels | 1,244 × 1,024 pixels | 2,487 × 2,048 pixels.
Original file (SVG file, nominally 612 × 504 pixels, file size: 10 KB)
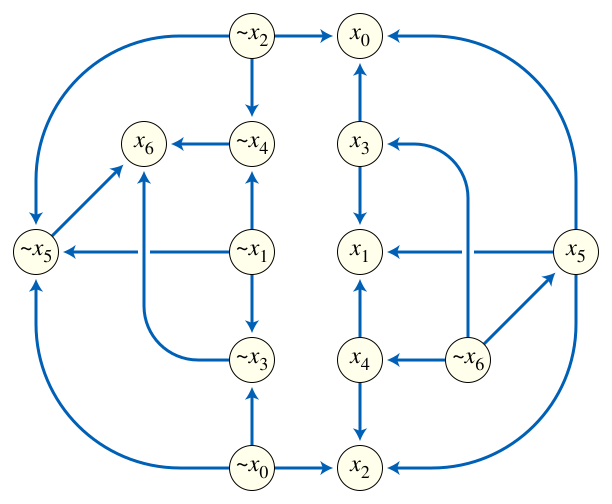
| Description | An implication graph | ||
| Date | |||
| Source | Own work | ||
| Author | David Eppstein | ||
| Permission (Reusing this file) |
|
Detailed description
This graph is formed from the 2-satisfiability instance

by replacing each disjunction by the two implications to which it is equivalent, e.g.,

and then representing the implications graphically as directed edges in a graph.
The solution set for the same example instance is depicted in Image:2SAT median graph.svg.
File history
Click on a date/time to view the file as it appeared at that time.
| Date/Time | Thumbnail | Dimensions | User | Comment | |
|---|---|---|---|---|---|
| current | 19:41, 29 November 2008 | | 612 × 504 (10 KB) | commons>David Eppstein | Fix ~x6 vertex in new drawing |
File usage
There are no pages that use this file.