File:Changes in climate indicators that show global warming.png
Jump to navigation
Jump to search

Size of this preview: 388 × 599 pixels. Other resolutions: 155 × 240 pixels | 311 × 480 pixels | 497 × 768 pixels | 663 × 1,024 pixels | 2,100 × 3,242 pixels.
Original file (2,100 × 3,242 pixels, file size: 1.39 MB, MIME type: image/png)
File history
Click on a date/time to view the file as it appeared at that time.
| Date/Time | Thumbnail | Dimensions | User | Comment | |
|---|---|---|---|---|---|
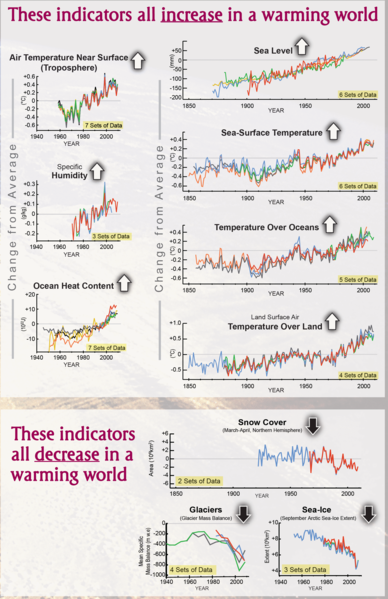
| current | 05:25, 20 June 2011 | | 2,100 × 3,242 (1.39 MB) | commons>Enescot | {{Information |Description ={{en|1=This image shows several graphs of climate indicators. The time period covered by each graph varies. The graphs are divided into two groups: (1) indicators that increase if the world is warming, and (2) indicators tha |
File usage
There are no pages that use this file.