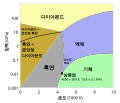
File:Carbon-phase-diagramp.svg

From WikiProjectMed
Jump to navigation Jump to search

Original file(SVG file, nominally 467 × 399 pixels, file size: 39 KB)

Render this image in .

This file is from a shared repository and may be used by other projects. The description on its file description page there is shown below.

Summary

Description Carbon phase diagram, based on calculations from 1980s. Newer work indicates that the melting point doesn't go above about 9000 K.
Source J.M. Zazula (1997). "On Graphite Transformations at High Temperature and Pressure Induced by Absorption of the LHC Beam". CERN. Retrieved 2010-07.
Author Trackler (talk) 13:05, 18 July 2010 (UTC)
Other versions

[edit]


.svg:

.png:

.jpg:

Translate this file This SVG file contains embedded text that can be translated into your language, using any capable SVG editor, text editor or the SVG Translate tool. For more information see: About translating SVG files.

Licensing

Public domain I, the copyright holder of this work, release this work into the public domain. This applies worldwide.
In some countries this may not be legally possible; if so:
I grant anyone the right to use this work for any purpose, without any conditions, unless such conditions are required by law.

Captions

Carbon phase diagram

image/svg+xml

ef02ea4034622c57bf7927bef9fff03a4b79b1c0

40,286 byte

399 pixel

467 pixel

File history

Click on a date/time to view the file as it appeared at that time.

Date/TimeThumbnailDimensionsUserComment
current08:07, 9 January 2023Thumbnail for version as of 08:07, 9 January 2023467 × 399 (39 KB)commons>Bjankuloski06File uploaded using svgtranslate tool (https://svgtranslate.toolforge.org/). Added translation for mk.

There are no pages that use this file.

Metadata