File:Capri sights.png
Jump to navigation
Jump to search
Size of this preview: 800 × 440 pixels. Other resolutions: 320 × 176 pixels | 640 × 352 pixels | 1,024 × 563 pixels | 1,280 × 704 pixels | 2,000 × 1,100 pixels.
Original file (2,000 × 1,100 pixels, file size: 1.05 MB, MIME type: image/png)
Summary
| Description |
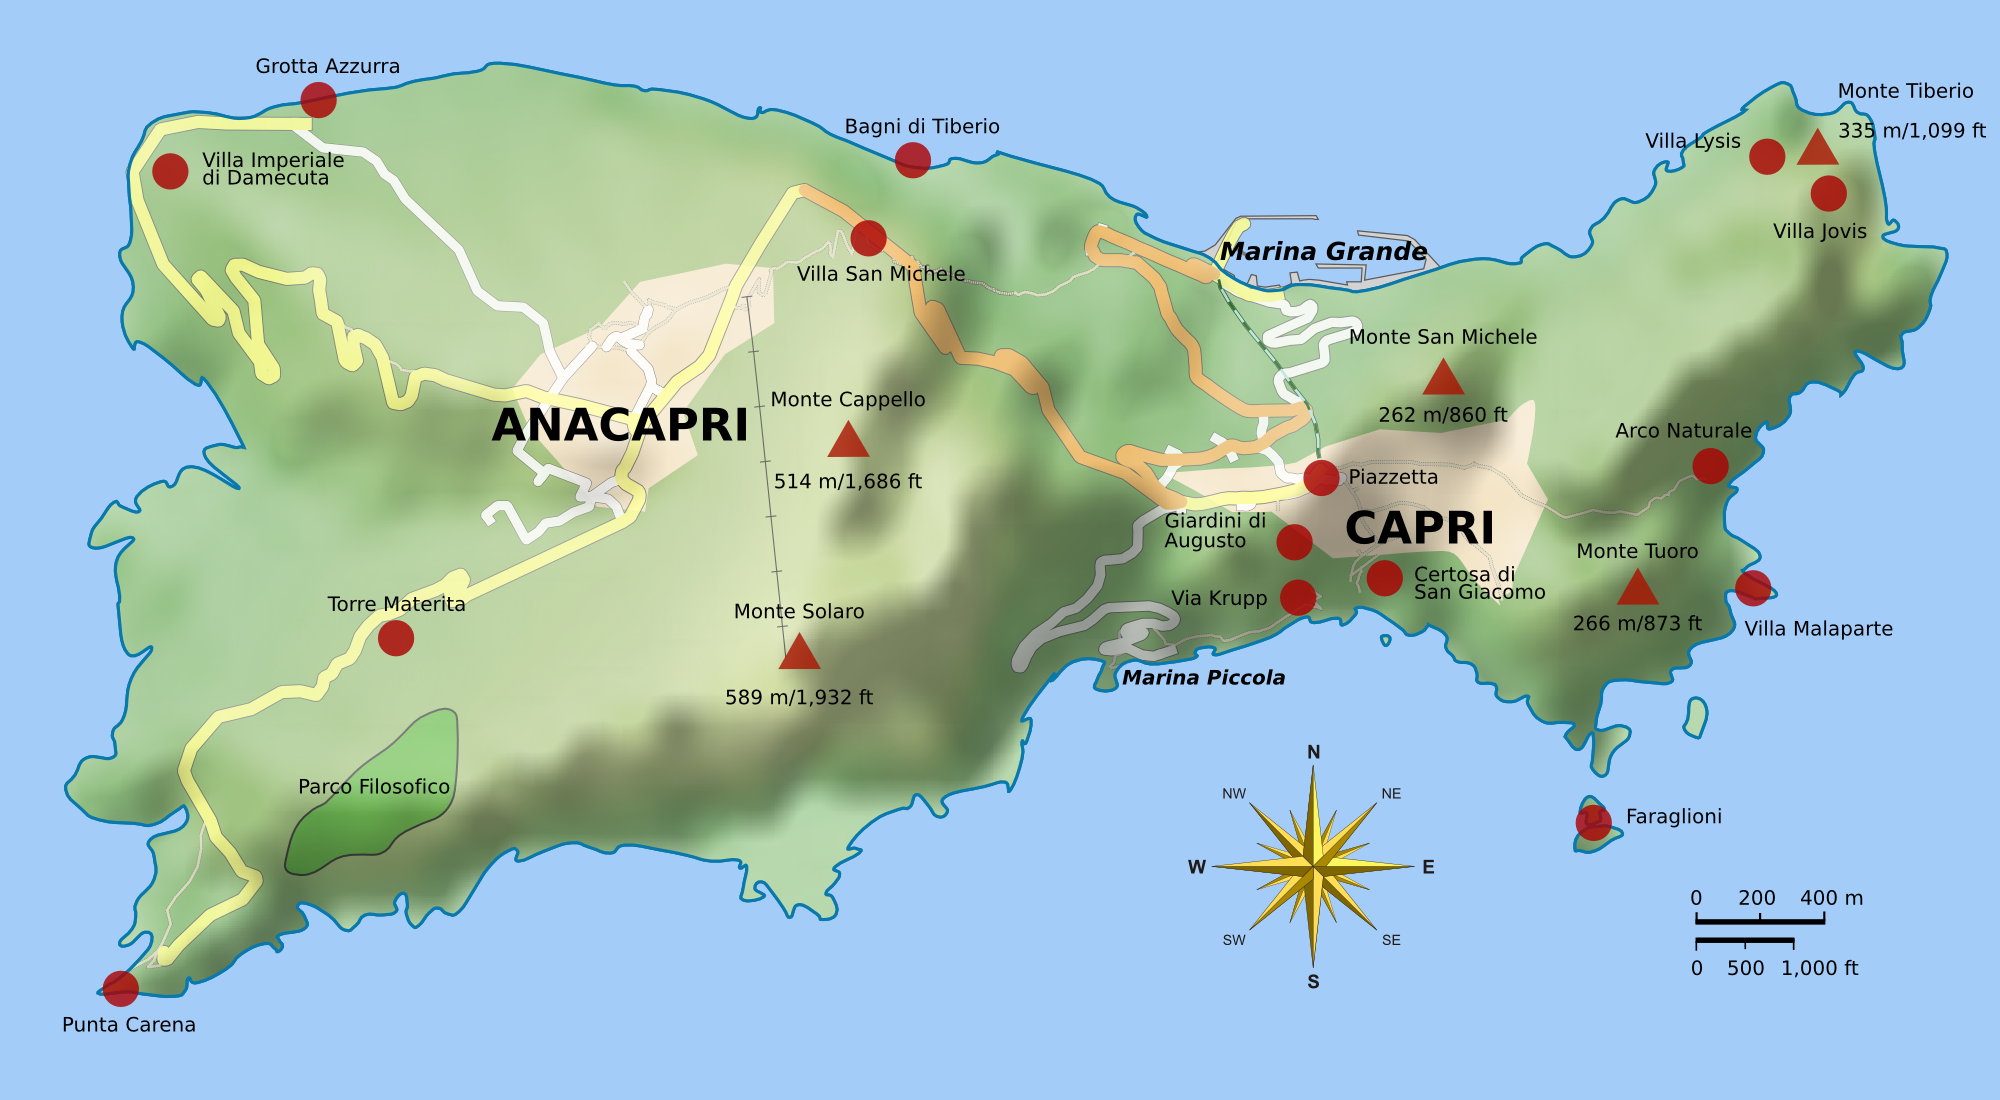
English: Map of Capri. Uses terrain data from SRTM3 (http://dds.cr.usgs.gov/srtm/version2_1/SRTM3/Eurasia/N40E014.hgt.zip). Bitmap version of File:Capri_sights_terrain.svg.
|
| Date | |
| Source | Own work |
| Author |
Morn the Gorn compass rose from Maps_template-fr.svg: Eric Gaba (Sting - fr:Sting) Road and rail data from OpenStreetMap |
| Other versions |
|


Code
Terrain shading layer was generated with the following Python script (requires Python Imaging Library and NumPy):
# Read SRTM3 file and create shaded relief

# 2010-04-05

from struct import unpack,calcsize

from numpy import *
import numpy as np
from PIL import Image

row_length = 1201	# row_length is 1201 for SRTM3 or 3601 for SRTM1
file_name  = "N40E014.hgt"	# from http://dds.cr.usgs.gov/srtm/version2_1/SRTM3/Eurasia/
hlim       = 800	# height limit for map [m]

ref_lat    = 40.55	# reference latitude
earth_eq   = 6371. * 1000. * 2. * pi
x_scale    = 1./360.*earth_eq*cos(ref_lat/180.*pi)/row_length
y_scale    = 1./360.*earth_eq/row_length

print "1 pixel = %u * %u m" % (x_scale, y_scale)
print "factor", y_scale/x_scale

h = zeros((row_length, row_length))
f = open(file_name, 'r')
li = []

for j in range(row_length):
	for i in range(row_length):
		d = f.read(2)
		(height,) = unpack('>h', d)
	        h[i,j] = height
		if height < -1000:
			li.append((i,j))

hmax = h.max()
h3 = zeros_like(h)
h3[:,:] = h[:,:]
print len(li), "missing data points"

def get_nei(z):
	h2 = h[z[0]-1:z[0]+2,z[1]-1:z[1]+2]
	nn = sum(where(h2 < -1000, 0, 1))
	av = sum(where(h2 > -1000, h2, 0)) / float(nn)
	return nn, av

# fill missing points with a nearest-neighbor averaging method:
loop = len(li)
lim = 7
while loop > 0:
	sd = False
	for q in range(len(li)):
		if h[li[q]] > -1000.: continue
		n, a = get_nei(li[q])
		if n >= lim:
			print li[q],loop, n, a, lim
			h3[li[q]] = a
			loop -= 1
			sd = True
	if not sd: lim -= 1
	h[:,:] = h3[:,:]
print "missing points done"

def hext(a):
	"Hex color to triplet."
	r,g,b = a[0:2], a[2:4], a[4:6]
	return int(r, 16), int(g, 16), int(b, 16)

# from http://en.wikipedia.org/wiki/Wikipedia:WikiProject_Maps/Conventions/Topographic_maps:
col_sea = hext("0978ab")
cols = """
{{Mapcolor|r=245|v=244|b=242|hex=#F5F4F2|col=black}}
{{Mapcolor|r=224|v=222|b=216|hex=#E0DED8|col=black}}
{{Mapcolor|r=202|v=195|b=184|hex=#CAC3B8|col=black}}
{{Mapcolor|r=186|v=174|b=154|hex=#BAAE9A|col=black}}
{{Mapcolor|r=172|v=154|b=124|hex=#AC9A7C|col=black}}
{{Mapcolor|r=170|v=135|b=83|hex=#AA8753|col=black}}
{{Mapcolor|r=185|v=152|b=90|hex=#B9985A|col=black}}
{{Mapcolor|r=195|v=167|b=107|hex=#C3A76B|col=black}}
{{Mapcolor|r=202|v=185|b=130|hex=#CAB982|col=black}}
{{Mapcolor|r=211|v=202|b=157|hex=#D3CA9D|col=black}}
{{Mapcolor|r=222|v=214|b=163|hex=#DED6A3|col=black}}
{{Mapcolor|r=232|v=225|b=182|hex=#E8E1B6|col=black}}
{{Mapcolor|r=239|v=235|b=192|hex=#EFEBC0|col=black}}
{{Mapcolor|r=225|v=228|b=181|hex=#E1E4B5|col=black}}
{{Mapcolor|r=209|v=215|b=171|hex=#D1D7AB|col=black}}
{{Mapcolor|r=189|v=204|b=150|hex=#BDCC96|col=black}}
{{Mapcolor|r=168|v=198|b=143|hex=#A8C68F|col=black}}
{{Mapcolor|r=148|v=191|b=139|hex=#94BF8B|col=black}}
{{Mapcolor|r=172|v=208|b=165|hex=#ACD0A5|col=black}}
"""
col = []

for l in cols.splitlines():
	if len(l) < 10: continue
	i = l.find('#')
	if i > -1:
		col.append(hext(l[i+1:i+7]))

col.reverse()	# -> bottom to top

o = Image.new('RGB', h.shape)

def interp(c, f):
	"Interpolate into color table."
	r = int((1.-f) * col[c][0] + f * col[c+1][0])
	g = int((1.-f) * col[c][1] + f * col[c+1][1])
	b = int((1.-f) * col[c][2] + f * col[c+1][2])
	return r,g,b

for j in range(row_length):
	for i in range(row_length):
		c, f = divmod(h[j,i] / hmax * (len(col)-1), 1)
		if 0 < h[j,i] < hmax:
			o.putpixel((j,i), interp(int(c), f))
		elif h[i,j] == hmax:
			o.putpixel((j,i), col[-1])
		else: o.putpixel((j,i), col_sea)

o.save("map_height.png")	# save height map
o2 = o.crop((0,0,942,603))
o2.save("map_height_cropped.png")

# taken from hillshade.py:
#def illumination(idata,azdeg=315.0,altdeg=45.):
def illumination(idata,azdeg=225.0,altdeg=45.):
    # convert alt, az to radians
    az = azdeg*np.pi/180.0
    alt = altdeg*np.pi/180.0
    # gradient in x and y directions
    dx, dy = np.gradient(idata)
    slope = 0.5*np.pi - np.arctan(np.hypot(dx, dy))
    aspect = np.arctan2(dx, dy)
    odata = np.sin(alt)*np.sin(slope) + np.cos(alt)*np.cos(slope)*np.cos(-az -\
             aspect - 0.5*np.pi)
    # rescale to interval -1,1
    # 1 means maximum sun exposure and 0 means complete shade.
    odata = (odata - odata.min())/(odata.max() - odata.min())
    return odata

il = 255 * illumination(h)

o4 = Image.new('RGBA', il.shape)
for j in range(row_length-1):
	for i in range(row_length-1):
		v = int(il[j,i])
		if 0 <= v < 128:
			alpha = (255 - 2*v)
			o4.putpixel((j,i), (0,0,0,alpha))
		elif v == 128:
			o4.putpixel((j,i), (0,0,0,0))
		elif 128 < v < 256:
			alpha = 2*(v-128)
			o4.putpixel((j,i), (255,255,255,alpha))
		else:
			o4.putpixel((j,i), (255,255,255,0))
o4.save("il_NW_alpha.png")	# NW-illuminated (alpha transparency for use with Inkscape)
Licensing
I, the copyright holder of this work, hereby publish it under the following licenses:
This file is licensed under the Creative Commons Attribution-Share Alike 3.0 Unported license.
- You are free:
- to share – to copy, distribute and transmit the work
- to remix – to adapt the work
- Under the following conditions:
- attribution – You must give appropriate credit, provide a link to the license, and indicate if changes were made. You may do so in any reasonable manner, but not in any way that suggests the licensor endorses you or your use.
- share alike – If you remix, transform, or build upon the material, you must distribute your contributions under the same or compatible license as the original.

|
Permission is granted to copy, distribute and/or modify this document under the terms of the GNU Free Documentation License, Version 1.2 or any later version published by the Free Software Foundation; with no Invariant Sections, no Front-Cover Texts, and no Back-Cover Texts. A copy of the license is included in the section entitled GNU Free Documentation License. |
You may select the license of your choice.
File history
Click on a date/time to view the file as it appeared at that time.
| Date/Time | Thumbnail | Dimensions | User | Comment | |
|---|---|---|---|---|---|
| current | 22:15, 30 September 2010 | | 2,000 × 1,100 (1.05 MB) | commons>Morn | added OpenStreetMap layer |
File usage
There are no pages that use this file.