File:Annual world greenhouse gas emissions, in 2005, by sector.png
Jump to navigation
Jump to search
Size of this preview: 636 × 599 pixels. Other resolutions: 255 × 240 pixels | 509 × 480 pixels | 815 × 768 pixels | 1,040 × 980 pixels.
Original file (1,040 × 980 pixels, file size: 29 KB, MIME type: image/png)
File history
Click on a date/time to view the file as it appeared at that time.
| Date/Time | Thumbnail | Dimensions | User | Comment | |
|---|---|---|---|---|---|
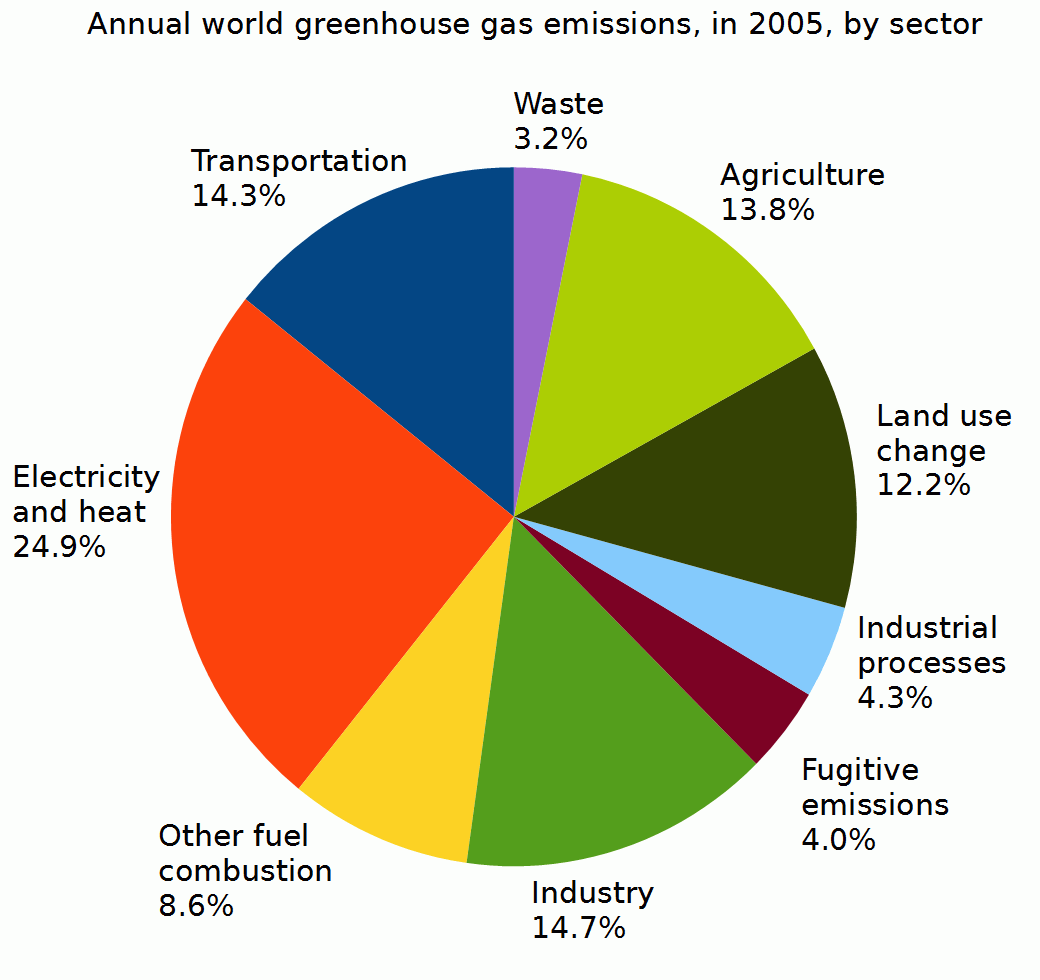
| current | 05:43, 24 November 2012 | | 1,040 × 980 (29 KB) | commons>Enescot | {{Information |Description ={{en|1=This pie chart shows annual world greenhouse gas emissions, in 2005, by sector. Emissions are measured as a percentage of total world carbon dioxide equivalent emissions: *Electricity and heat, 24.9% *Industry, 14.... |
File usage
There are no pages that use this file.