File:1960- Tax rates of richest versus low income people - US.svg
Jump to navigation
Jump to search

Size of this PNG preview of this SVG file: 800 × 600 pixels. Other resolutions: 320 × 240 pixels | 640 × 480 pixels | 1,024 × 768 pixels | 1,280 × 960 pixels | 2,560 × 1,920 pixels | 1,000 × 750 pixels.
Original file (SVG file, nominally 1,000 × 750 pixels, file size: 6 KB)
Summary
| Description |
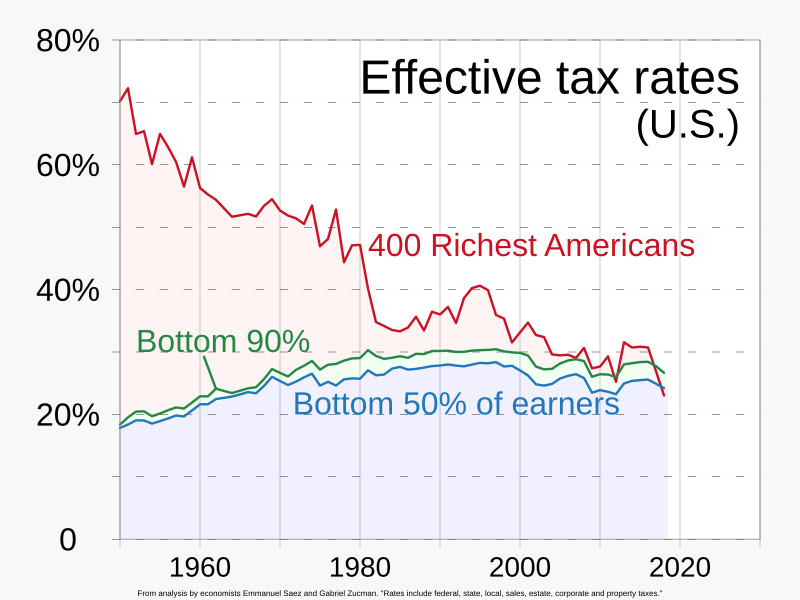
English: Chart comparing effective total (federal and state and local) tax rates in the United States, of the richest Americans and those in the bottom 50% of earners
|
||
| Date | |||
| Source | Own work | ||
| Author | RCraig09 |

Licensing
I, the copyright holder of this work, hereby publish it under the following license:
This file is licensed under the Creative Commons Attribution-Share Alike 4.0 International license.
- You are free:
- to share – to copy, distribute and transmit the work
- to remix – to adapt the work
- Under the following conditions:
- attribution – You must give appropriate credit, provide a link to the license, and indicate if changes were made. You may do so in any reasonable manner, but not in any way that suggests the licensor endorses you or your use.
- share alike – If you remix, transform, or build upon the material, you must distribute your contributions under the same or compatible license as the original.
File history
Click on a date/time to view the file as it appeared at that time.
| Date/Time | Thumbnail | Dimensions | User | Comment | |
|---|---|---|---|---|---|
| current | 16:28, 15 May 2024 | | 1,000 × 750 (6 KB) | commons>RCraig09 | Version 3: add green segment between "Bottom 90%" and green line, to avoid inference that "Bottom 90%P applies to light red area |
File usage
There are no pages that use this file.