Cambridge City Council elections
(Redirected from Cambridge local elections)
One third of Cambridge City Council is elected each year, followed by one year without election.
Seats on Council
| Year | Liberal Democrats | Labour | Conservative | Green | Independent |
|---|---|---|---|---|---|
| 2011 | 26 | 13 | 0 | 2 | 1 |
| 2012 | 21 | 18 | 1 | 1 | 1 |
| 2014 | 15 | 24 | 1 | 0 | 2 |
| 2015 | 14 | 24 | 1 | 1 | 2 |
| 2016 | 13 | 26 | 0 | 1 | 2 |
| 2018 | 14 | 26 | 0 | 1 | 1 |
| 2019 | 15 | 26 | 0 | 0 | 1 |
| 2021 | 12 | 27 | 0 | 2 | 1 |
Council elections
- 1973 Cambridge City Council election
- 1976 Cambridge City Council election (New ward boundaries)[1]
- 1978 Cambridge City Council election
- 1979 Cambridge City Council election
- 1980 Cambridge City Council election
- 1982 Cambridge City Council election
- 1983 Cambridge City Council election
- 1984 Cambridge City Council election
- 1986 Cambridge City Council election
- 1987 Cambridge City Council election
- 1988 Cambridge City Council election
- 1990 Cambridge City Council election
- 1991 Cambridge City Council election
- 1992 Cambridge City Council election
- 1994 Cambridge City Council election
- 1995 Cambridge City Council election
- 1996 Cambridge City Council election
- 1998 Cambridge City Council election
- 1999 Cambridge City Council election
- 2000 Cambridge City Council election
- 2002 Cambridge City Council election
- 2003 Cambridge City Council election
- 2004 Cambridge City Council election (New ward boundaries)[2]
- 2006 Cambridge City Council election
- 2007 Cambridge City Council election
- 2008 Cambridge City Council election
- 2010 Cambridge City Council election
- 2011 Cambridge City Council election
- 2012 Cambridge City Council election
- 2014 Cambridge City Council election
- 2015 Cambridge City Council election
- 2016 Cambridge City Council election
- 2018 Cambridge City Council election
- 2019 Cambridge City Council election
- 2021 Cambridge City Council election (New ward boundaries)[3]
- 2022 Cambridge City Council election
- 2023 Cambridge City Council election
Results maps
-
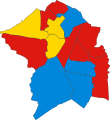
 1978 results map
 -
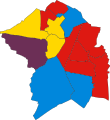
 1979 results map
 -
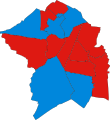
 1980 results map
 -
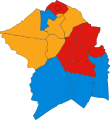
 1982 results map
 -
 1983 results map
 -
 1984 results map
 -
 1986 results map
 -
 1987 results map
 -
 1988 results map
 -
 1990 results map
 -
 1991 results map
 -
 1992 results map
 -
 1994 results map
 -
 1995 results map
 -
 1996 results map
 -
 1998 results map
 -
 1999 results map
 -
 2000 results map
 -
 2002 results map
 -
 2003 results map
 -
 2004 results map
 -
 2006 results map
 -
 2007 results map
 -
 2008 results map
 -
 2010 results map
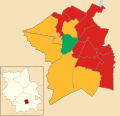
 -
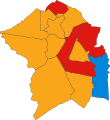
 2011 results map
 -
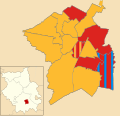
 2012 results map
 -
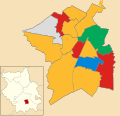
 2014 results map
 -
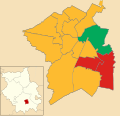
 2015 results map
 -
 2016 results map
 -
 2018 results map
 -
 2019 results map
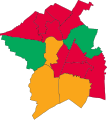
 -
 2021 results map
 -
 2022 results map
 -
 2023 results map
 -
 2024 results map


By-election results
1994-1998
| Party | Candidate | Votes | % | ±% | |
|---|---|---|---|---|---|
| Labour | Anthony Schofield | 1,769 | 51.3 | -3.6 | |
| Conservative | Mark Taylor | 1,106 | 32.1 | -2.5 | |
| Liberal Democrats | Tim Wesson | 571 | 16.6 | +6.0 | |
| Majority | 663 | 19.2 | |||
| Turnout | 3,446 | ||||
| Labour hold | Swing | ||||
| Party | Candidate | Votes | % | ±% | |
|---|---|---|---|---|---|
| Labour | Hannah Reed | 664 | 58.5 | -3.9 | |
| Liberal Democrats | Michael Dixon | 186 | 16.4 | -8.7 | |
| Conservative | Peter Welton | 121 | 10.7 | -1.9 | |
| Green | Margaret Wright | 117 | 10.3 | +10.3 | |
| Independent | Laurence Jones | 48 | 4.2 | +4.2 | |
| Majority | 478 | 42.1 | |||
| Turnout | 1,136 | 15.8 | |||
| Labour hold | Swing | ||||
1998-2002
| Party | Candidate | Votes | % | ±% | |
|---|---|---|---|---|---|
| Liberal Democrats | Rhodri James | 723 | 44.5 | +29.8 | |
| Labour | Stuart Newbold | 540 | 33.2 | -24.0 | |
| Conservative | Mark Taylor | 312 | 19.2 | -8.9 | |
| Green | Stephen Lawrence | 51 | 3.1 | +3.1 | |
| Majority | 183 | 11.3 | |||
| Turnout | 1,626 | 31.7 | |||
| Liberal Democrats gain from Labour | Swing | ||||
2002-2006
| Party | Candidate | Votes | % | ±% | |
|---|---|---|---|---|---|
| Labour | Benjamin Stafford | 829 | 46.8 | +13.0 | |
| Liberal Democrats | Andrew Blackhurst | 638 | 36.0 | +14.8 | |
| Conservative | Steven Mastin | 263 | 14.8 | -7.4 | |
| UKIP | Albert Watts | 42 | 2.4 | -5.7 | |
| Majority | 191 | 10.8 | |||
| Turnout | 1,772 | 30.2 | |||
| Labour hold | Swing | ||||
2006-2010
| Party | Candidate | Votes | % | ±% | |
|---|---|---|---|---|---|
| Liberal Democrats | Andrew Blackhurst | 858 | 51.4 | +5.9 | |
| Conservative | John Ionides | 618 | 37.0 | +1.3 | |
| Labour | Pamela Stacey | 109 | 6.5 | -2.6 | |
| Green | Ceri Galloway | 85 | 5.1 | -4.6 | |
| Majority | 240 | 14.4 | |||
| Turnout | 1,675 | 30.9 | |||
| Liberal Democrats hold | Swing | ||||
| Party | Candidate | Votes | % | ±% | |
|---|---|---|---|---|---|
| Liberal Democrats | 836 | 37.6 | -0.8 | ||
| Conservative | 552 | 24.9 | -3.6 | ||
| Labour | 319 | 14.4 | -3.8 | ||
| Green | 313 | 14.1 | +4.1 | ||
| UKIP | 201 | 9.0 | +9.0 | ||
| Majority | 284 | 12.8 | |||
| Turnout | 2,221 | ||||
| Liberal Democrats hold | Swing | ||||
2010-2014
| Party | Candidate | Votes | % | ±% | |
|---|---|---|---|---|---|
| Labour | George Owers | 900 | 44.0 | +11.7 | |
| Conservative | Andrew Bower | 734 | 35.9 | +7.5 | |
| Liberal Democrats | Sarah Barnes | 223 | 10.9 | -14.6 | |
| Green | Valerie Hopkins | 137 | 6.7 | -4.2 | |
| UKIP | Albert Watts | 53 | 2.6 | -0.3 | |
| Majority | 166 | 8.1 | |||
| Turnout | 2,047 | ||||
| Labour gain from Conservative | Swing | ||||
| Party | Candidate | Votes | % | ±% | |
|---|---|---|---|---|---|
| Labour | Peter Roberts | 878 | 51.4 | -3.0 | |
| Green | Oliver Perkins | 336 | 19.7 | -4.2 | |
| Conservative | Eric Barrett-Payton | 284 | 16.6 | +4.2 | |
| Liberal Democrats | Marcus Streets | 209 | 12.2 | +2.9 | |
| Majority | 542 | 31.8 | |||
| Turnout | 1,707 | ||||
| Labour gain from Green | Swing | ||||
2014-2018
| Party | Candidate | Votes | % | ±% | |
|---|---|---|---|---|---|
| Liberal Democrats | Viki Sanders | 933 | 36.5 | -6.1 | |
| Labour | Rahima Ahammed | 790 | 30.9 | +1.2 | |
| Conservative | Andrew Bower | 614 | 24.0 | +7.7 | |
| Green | Joel Chalfen | 222 | 8.7 | -2.7 | |
| Majority | 143 | 5.6 | |||
| Turnout | 2,559 | ||||
| Liberal Democrats gain from Labour | Swing | ||||
| Party | Candidate | Votes | % | ±% | |
|---|---|---|---|---|---|
| Labour | Patrick Sheil | 1,267 | 46.8 | -14.7 | |
| Liberal Democrats | Tim Ward | 992 | 36.5 | +20.8 | |
| Conservative | Henry Collins | 450 | 16.6 | +4.5 | |
| Majority | 275 | 10.2 | |||
| Turnout | 2,709 | ||||
| Labour hold | Swing | ||||
2018-2022
| Party | Candidate | Votes | % | ±% | |
|---|---|---|---|---|---|
| Labour | Kelley Green | 873 | 47.9 | -10.4 | |
| Liberal Democrats | Sarah Brown | 663 | 36.4 | +16.4 | |
| Green | Virgin Ierubino | 171 | 9.4 | -3.5 | |
| Conservative | Othman Cole | 115 | 6.3 | -2.5 | |
| Majority | 210 | 11.5 | |||
| Turnout | 1,822 | ||||
| Labour hold | Swing | ||||
| Party | Candidate | Votes | % | ±% | |
|---|---|---|---|---|---|
| Liberal Democrats | Josh Matthews | 774 | 59.5 | +16.3 | |
| Labour | Niamh Marian Sweeney | 235 | 18.1 | -18.1 | |
| Green | Mark Slade | 149 | 11.5 | +1.5 | |
| Conservative | Michael David Spencer | 143 | 11.0 | +0.2 | |
| Majority | 539 | 41.4 | |||
| Turnout | 1,301 | ||||
| Liberal Democrats hold | Swing | ||||
2022-2026
| Party | Candidate | Votes | % | ±% | |
|---|---|---|---|---|---|
| Liberal Democrats | David Levien | 1,017 | 49.8 | ||
| Labour | Rahima Ahammed | 472 | 23.1 | ||
| Green | Ceri Galloway | 298 | 14.6 | ||
| Conservative | Shapour Meftah | 256 | 12.5 | ||
| Majority | 545 | 26.7 | |||
| Turnout | 2,043 | ||||
| Liberal Democrats hold | Swing | ||||
| Party | Candidate | Votes | % | ±% | |
|---|---|---|---|---|---|
| Conservative | Mohamed Delowar Hossain | 622 | 34.9 | +3.0 | |
| Labour | Zarina Anwar | 598 | 33.6 | -5.6 | |
| Liberal Democrats | Jamie Leon Dalzell | 418 | 23.5 | +8.5 | |
| Green | Elizabeth Alice May | 142 | 8.0 | –6.0 | |
| Majority | 24 | 1.3 | |||
| Turnout | 1,780 | 26.7 | |||
| Conservative gain from Labour | Swing | ||||
References
- ^ The City of Cambridge (Electoral Arrangements) Order 1975
- ^ legislation.gov.uk - The City of Cambridge (Electoral Changes) Order 2002. Retrieved on 4 October 2015.
- ^ legislation.gov.uk - The Cambridge (Electoral Changes) Order 2019. Retrieved on 18 March 2024.
- ^ "Local Elections Archive Project — East Chesterton Ward". www.andrewteale.me.uk. Retrieved 22 October 2022.
- ^ "Local Elections Archive Project — Coleridge Ward". www.andrewteale.me.uk. Retrieved 22 October 2022.
- ^ "Local Elections Archive Project — Abbey Ward". www.andrewteale.me.uk. Retrieved 22 October 2022.
- ^ "Local Elections Archive Project — Queen Edith's Ward". www.andrewteale.me.uk. Retrieved 22 October 2022.
- ^ "Local Elections Archive Project — Arbury Ward". www.andrewteale.me.uk. Retrieved 22 October 2022.
- ^ "Local Elections Archive Project — Petersfield Ward". www.andrewteale.me.uk. Retrieved 22 October 2022.
- ^ "Cambridge City Council - Newnham By Election - Thursday, 8th August, 2019". democracy.cambridge.gov.uk. Cambridge City Council.
- ^ "Local Elections Archive Project — Trumpington Ward". www.andrewteale.me.uk. Retrieved 22 October 2022.
- ^ {{cite web|url=https://www.cambridge.gov.uk/news/2023/07/04/result-of-city-council-by-election-in-kings-hedges-ward%7Ctitle=Result of City Council by-election in King's Hedges ward|date=4 July 2023|access-date=5 July 2023|website=Cambridge City Council
External links
| Cambridgeshire County Council | |
|---|---|
| Peterborough City Council |
|
| Cambridge City Council | |
| East Cambridgeshire District Council | |
| Fenland District Council | |
| Huntingdonshire District Council | |
| South Cambridgeshire District Council | |
| Isle of Ely County Council | |
| Huntingdon & Peterborough County Council | |
| Mayor of Cambridgeshire and Peterborough | |
| |