El Doncello
Jump to navigation
Jump to search
El Doncello | |
|---|---|
Municipality and town | |
 | |
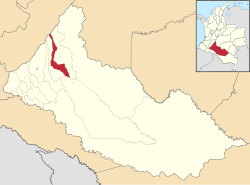
 Location of the municipality and town of El Doncello in the Caquetá Department of Colombia. | |
| Country | |
| Department | Caquetá Department |
| Population (Census 2018[1]) | |
| • Total | 17,775 |
| Time zone | UTC-5 (Colombia Standard Time) |
El Doncello is a town and municipality in Caquetá Department, Colombia with a population, according to a 2018 census, of 17,775.[1] There is evidence that it was first settled in the 1930s, but most large-scale official building occurred from the 1950s onwards. The immigrant families that first settled El Doncello came from various neighbouring regions and were mainly avoiding the monopolization of land in the country's centre; the colonization was more or less spontaneous, as there was no institution overseeing the process.
Climate
| Climate data for El Doncello (Maguare), elevation 270 m (890 ft), (1981–2010) | |||||||||||||
|---|---|---|---|---|---|---|---|---|---|---|---|---|---|
| Month | Jan | Feb | Mar | Apr | May | Jun | Jul | Aug | Sep | Oct | Nov | Dec | Year |
| Mean daily maximum °C (°F) | 32.7 (90.9) |
32.3 (90.1) |
31.2 (88.2) |
30.5 (86.9) |
29.8 (85.6) |
28.9 (84.0) |
28.7 (83.7) |
29.9 (85.8) |
30.8 (87.4) |
31.0 (87.8) |
30.8 (87.4) |
31.8 (89.2) |
30.7 (87.3) |
| Daily mean °C (°F) | 26.8 (80.2) |
26.5 (79.7) |
25.9 (78.6) |
25.4 (77.7) |
25.1 (77.2) |
24.4 (75.9) |
24.2 (75.6) |
24.8 (76.6) |
25.4 (77.7) |
25.6 (78.1) |
25.8 (78.4) |
26.2 (79.2) |
25.5 (77.9) |
| Mean daily minimum °C (°F) | 20.8 (69.4) |
21.2 (70.2) |
21.5 (70.7) |
21.6 (70.9) |
21.5 (70.7) |
20.8 (69.4) |
20.3 (68.5) |
20.4 (68.7) |
20.7 (69.3) |
21.1 (70.0) |
21.4 (70.5) |
21.0 (69.8) |
21.0 (69.8) |
| Average precipitation mm (inches) | 76.4 (3.01) |
144.1 (5.67) |
292.2 (11.50) |
417.2 (16.43) |
370.9 (14.60) |
348.3 (13.71) |
303.5 (11.95) |
210.5 (8.29) |
234.8 (9.24) |
286.8 (11.29) |
213.5 (8.41) |
95.4 (3.76) |
2,942.3 (115.84) |
| Average precipitation days | 8 | 12 | 18 | 23 | 24 | 24 | 22 | 20 | 19 | 19 | 17 | 10 | 209 |
| Average relative humidity (%) | 75 | 78 | 83 | 86 | 86 | 87 | 86 | 84 | 83 | 83 | 83 | 80 | 83 |
| Mean monthly sunshine hours | 186.0 | 132.7 | 102.3 | 96.0 | 105.4 | 93.0 | 102.3 | 130.2 | 147.0 | 148.8 | 150.0 | 182.9 | 1,576.6 |
| Mean daily sunshine hours | 6.0 | 4.7 | 3.3 | 3.2 | 3.4 | 3.1 | 3.3 | 4.2 | 4.9 | 4.8 | 5.0 | 5.9 | 4.3 |
| Source: Instituto de Hidrologia Meteorologia y Estudios Ambientales[2] | |||||||||||||
References
- ^ a b "Censo Nacional de Población y Vivienda 2018" (in Spanish). DANE. Retrieved 23 April 2020.
- ^ "Promedios Climatológicos 1981–2010" (in Spanish). Instituto de Hidrologia Meteorologia y Estudios Ambientales. Archived from the original on 15 August 2016. Retrieved 17 June 2024.
Categories:
- CS1 Spanish-language sources (es)
- Pages using gadget WikiMiniAtlas
- Articles with short description
- Short description is different from Wikidata
- Pages using infobox settlement with no coordinates
- Coordinates on Wikidata
- Municipalities of Caquetá Department
- All stub articles
- Amazonia Region (Colombia) geography stubs

