File:Wiggers Diagram.png
Wiggers_Diagram.png (651 × 470 pixels, file size: 36 KB, MIME type: image/png)
This file is from a shared repository and may be used by other projects. The description on its file description page there is shown below.
Contents
Summary
| DescriptionWiggers Diagram.png |
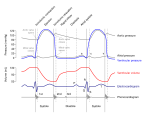
English: A Wiggers diagram, showing the cardiac cycle events occuring in the left ventricle.
In the atrial pressure plot: wave "a" corresponds to atrial contraction, wave "c" corresponds to an increase in pressure from the closed mitral valve bulging into the atrium during ventricular systole, and wave "v" corresponds to passive atrial filling. In the electrocardiogram: wave "P" corresponds to the onset of atrial depolarization, waves "QRS" (aka QRS complex) correspond to the onset of ventricular depolarization, and wave "T" corresponds to ventricular repolarization. In the phonocardiogram: The sound labeled 1st contributes to the S1 heart sound and is the reverberation of blood from the sudden closure of the mitral valve (left A-V valve) and the sound labeled "2nd" contributes to the S2 heart sound and is the reverberation of blood from the sudden closure of the aortic valve. |
| Date | |
| Source | Wikimedia Commons, File:Cardiac Cycle Left Ventricle.PNG. Source file has a serious mistake which was corrected in the new image. |
| Author | DanielChangMD revised original work of DestinyQx |
| Other versions |
[edit] SVG
PNG
|

|
File:Wiggers Diagram.svg is a vector version of this file. It should be used in place of this PNG file when not inferior.
File:Wiggers Diagram.png → File:Wiggers Diagram.svg
For more information, see Help:SVG.
|
This a revision on the work by DestinyQx whose original image can be found here: http://commons.wikimedia.org/wiki/File:Cardiac_Cycle_Left_Ventricle.PNG
The original image incorrectly portrays aortic valve closure which occurs when left ventricular pressure falls below aortic pressure. This has been corrected in this revision. Some spelling has also been corrected. The credit for the original drawing goes to DestinyQx.
The additions to the description have been added by myself.
Licensing
- You are free:
- to share – to copy, distribute and transmit the work
- to remix – to adapt the work
- Under the following conditions:
- attribution – You must give appropriate credit, provide a link to the license, and indicate if changes were made. You may do so in any reasonable manner, but not in any way that suggests the licensor endorses you or your use.
- share alike – If you remix, transform, or build upon the material, you must distribute your contributions under the same or compatible license as the original.
Captions
Items portrayed in this file
depicts
8 November 2011
File history
Click on a date/time to view the file as it appeared at that time.
| Date/Time | Thumbnail | Dimensions | User | Comment | |
|---|---|---|---|---|---|
| current | 04:38, 11 December 2011 |  | 651 × 470 (36 KB) | commons>DanielChangMD | Fixed aortic pressure curve to more accurately portray the relationship between aortic and ventricular pressure with regard to rapid and slow ejection phases. |
File usage
The following page uses this file:
Metadata
This file contains additional information, probably added from the digital camera or scanner used to create or digitize it.
If the file has been modified from its original state, some details may not fully reflect the modified file.
| Horizontal resolution | 37.8 dpc |
|---|---|
| Vertical resolution | 37.8 dpc |


