This file is from a shared repository and may be used by other projects.
The description on its file description page there is shown below.
License
Attribution-NonCommercial 3.0 Unported (CC BY-NC 3.0)
Summary
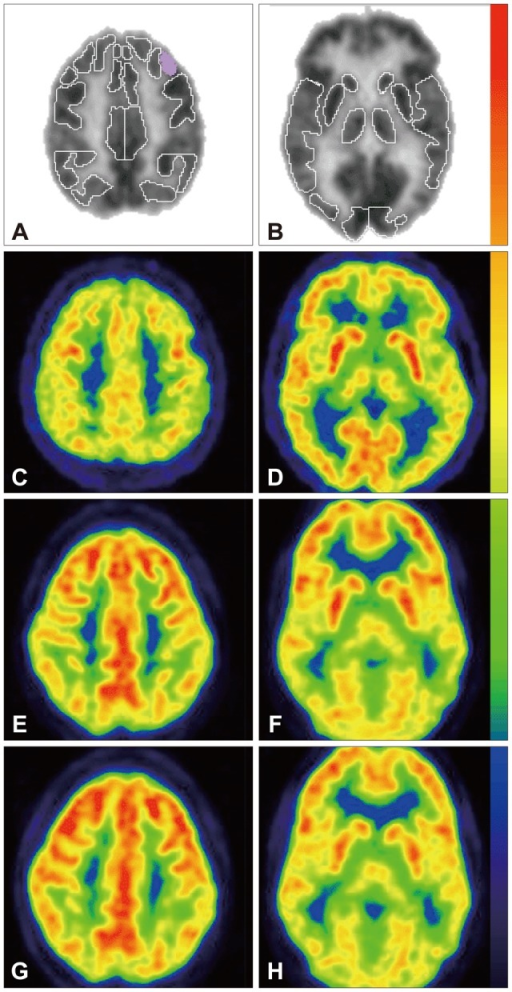
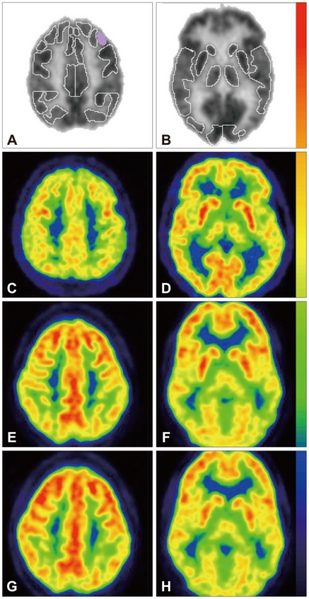
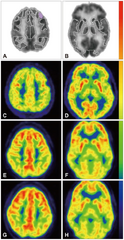
Author:Ficicioglu C, Dubroff JG, Thomas N, Gallagher PR, Burfield J, Hussa C, Randall R, Zhuang H ,Children's Hospital of Philadelphia, University of Pennsylvania, Perelman School of Medicine, Section of Biochemical Genetics(Openi/National Library of Medicine) Source:https://openi.nlm.nih.gov/detailedresult?img=PMC3722466_jcn-9-151-g001&query=Sapropterin&it=xg&req=4&npos=13 Description:F1: Representative [F-18] FDG-PET transaxial images throughout the cortices (A, C, E and G) and mid-brain (B, D, F and H). [F-18] FDG-PET regions of interest are shown in (A) and (B) as determined by Philips NeuroQ (version 3.0) as well as corresponding locations in a representative normal brain (C and D) and one of this study's participants before (E and F) and after (G and H) Sapropterin supplementation (126 days). Note the purple shaded region in (A) designates Broca's area in which a significant increase in glucose metabolism was found in response to therapy. Tracer uptake intensity color legend is shown to the right of the images (red/yellow=highest, black/violet=lowest). Note the depressed glucose metabolism in the frontal cortices relative to the parietal cortices in the PKU patient (E-H) compared to the normal example (C and D). This pattern was present in all patients. FDG-PET: fluorodeoxyglucose positron emission tomography.
File history
Click on a date/time to view the file as it appeared at that time.
| Date/Time | Thumbnail | Dimensions | User | Comment |
|---|
| current | 23:41, 8 January 2022 | 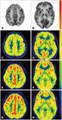 | 512 × 992 (940 KB) | Ozzie10aaaa | Author:Ficicioglu C, Dubroff JG, Thomas N, Gallagher PR, Burfield J, Hussa C, Randall R, Zhuang H ,Children's Hospital of Philadelphia, University of Pennsylvania, Perelman School of Medicine, Section of Biochemical Genetics(Openi/National Library of Medicine) Source:https://openi.nlm.nih.gov/detailedresult?img=PMC3722466_jcn-9-151-g001&query=Sapropterin&it=xg&req=4&npos=13 Description:F1: Representative [F-18] FDG-PET transaxial images throughout the cortices (A, C, E and G) and mid-brain (B... |
File usage
The following page uses this file: