File:Indicatorslongrun579.gif
Jump to navigation
Jump to search
No higher resolution available.
Indicatorslongrun579.gif (578 × 185 pixels, file size: 5 KB, MIME type: image/gif)
Summary
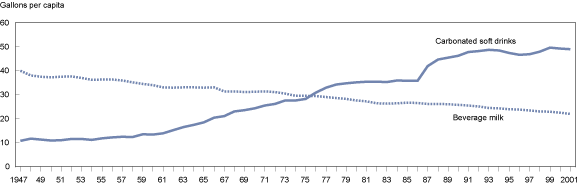
This is a graph from the USDA showing the increase in consumption of soft drinks and the decrease in consumption of milk. It is from a USDA publication, Amber Waves, at this location:www.ers.usda.gov/Amberwaves/April04/pdf/indicators.pdf
Licensing
This work is in the public domain in the United States because it is a work prepared by an officer or employee of the United States Government as part of that person’s official duties under the terms of Title 17, Chapter 1, Section 105 of the US Code.
Note: This only applies to original works of the Federal Government and not to the work of any individual U.S. state, territory, commonwealth, county, municipality, or any other subdivision. This template also does not apply to postage stamp designs published by the United States Postal Service since 1978. (See § 313.6(C)(1) of Compendium of U.S. Copyright Office Practices). It also does not apply to certain US coins; see The US Mint Terms of Use.
|
 | |
| This file has been identified as being free of known restrictions under copyright law, including all related and neighboring rights. | ||
File history
Click on a date/time to view the file as it appeared at that time.
| Date/Time | Thumbnail | Dimensions | User | Comment | |
|---|---|---|---|---|---|
| current | 02:25, 8 May 2006 | 578 × 185 (5 KB) | commons>Prevail | This is a graph from the USDA showing the increase in consumption of soft drinks and the decrease in consumption of milk. It is from a USDA publication, Amber Waves, at this location:www.ers.usda.gov/Amberwaves/April04/pdf/indicators.pdf |
File usage
The following page uses this file: