File:HIV entry into T cell schematic.png
Original file (2,805 × 3,405 pixels, file size: 4.49 MB, MIME type: image/png)
Summary

|
This biology image could be re-created using vector graphics as an SVG file. This has several advantages; see Commons:Media for cleanup for more information. If an SVG form of this image is available, please upload it and afterwards replace this template with
{{vector version available|new image name}}.
It is recommended to name the SVG file “HIV entry into T cell schematic.svg”—then the template Vector version available (or Vva) does not need the new image name parameter. |
| Description |
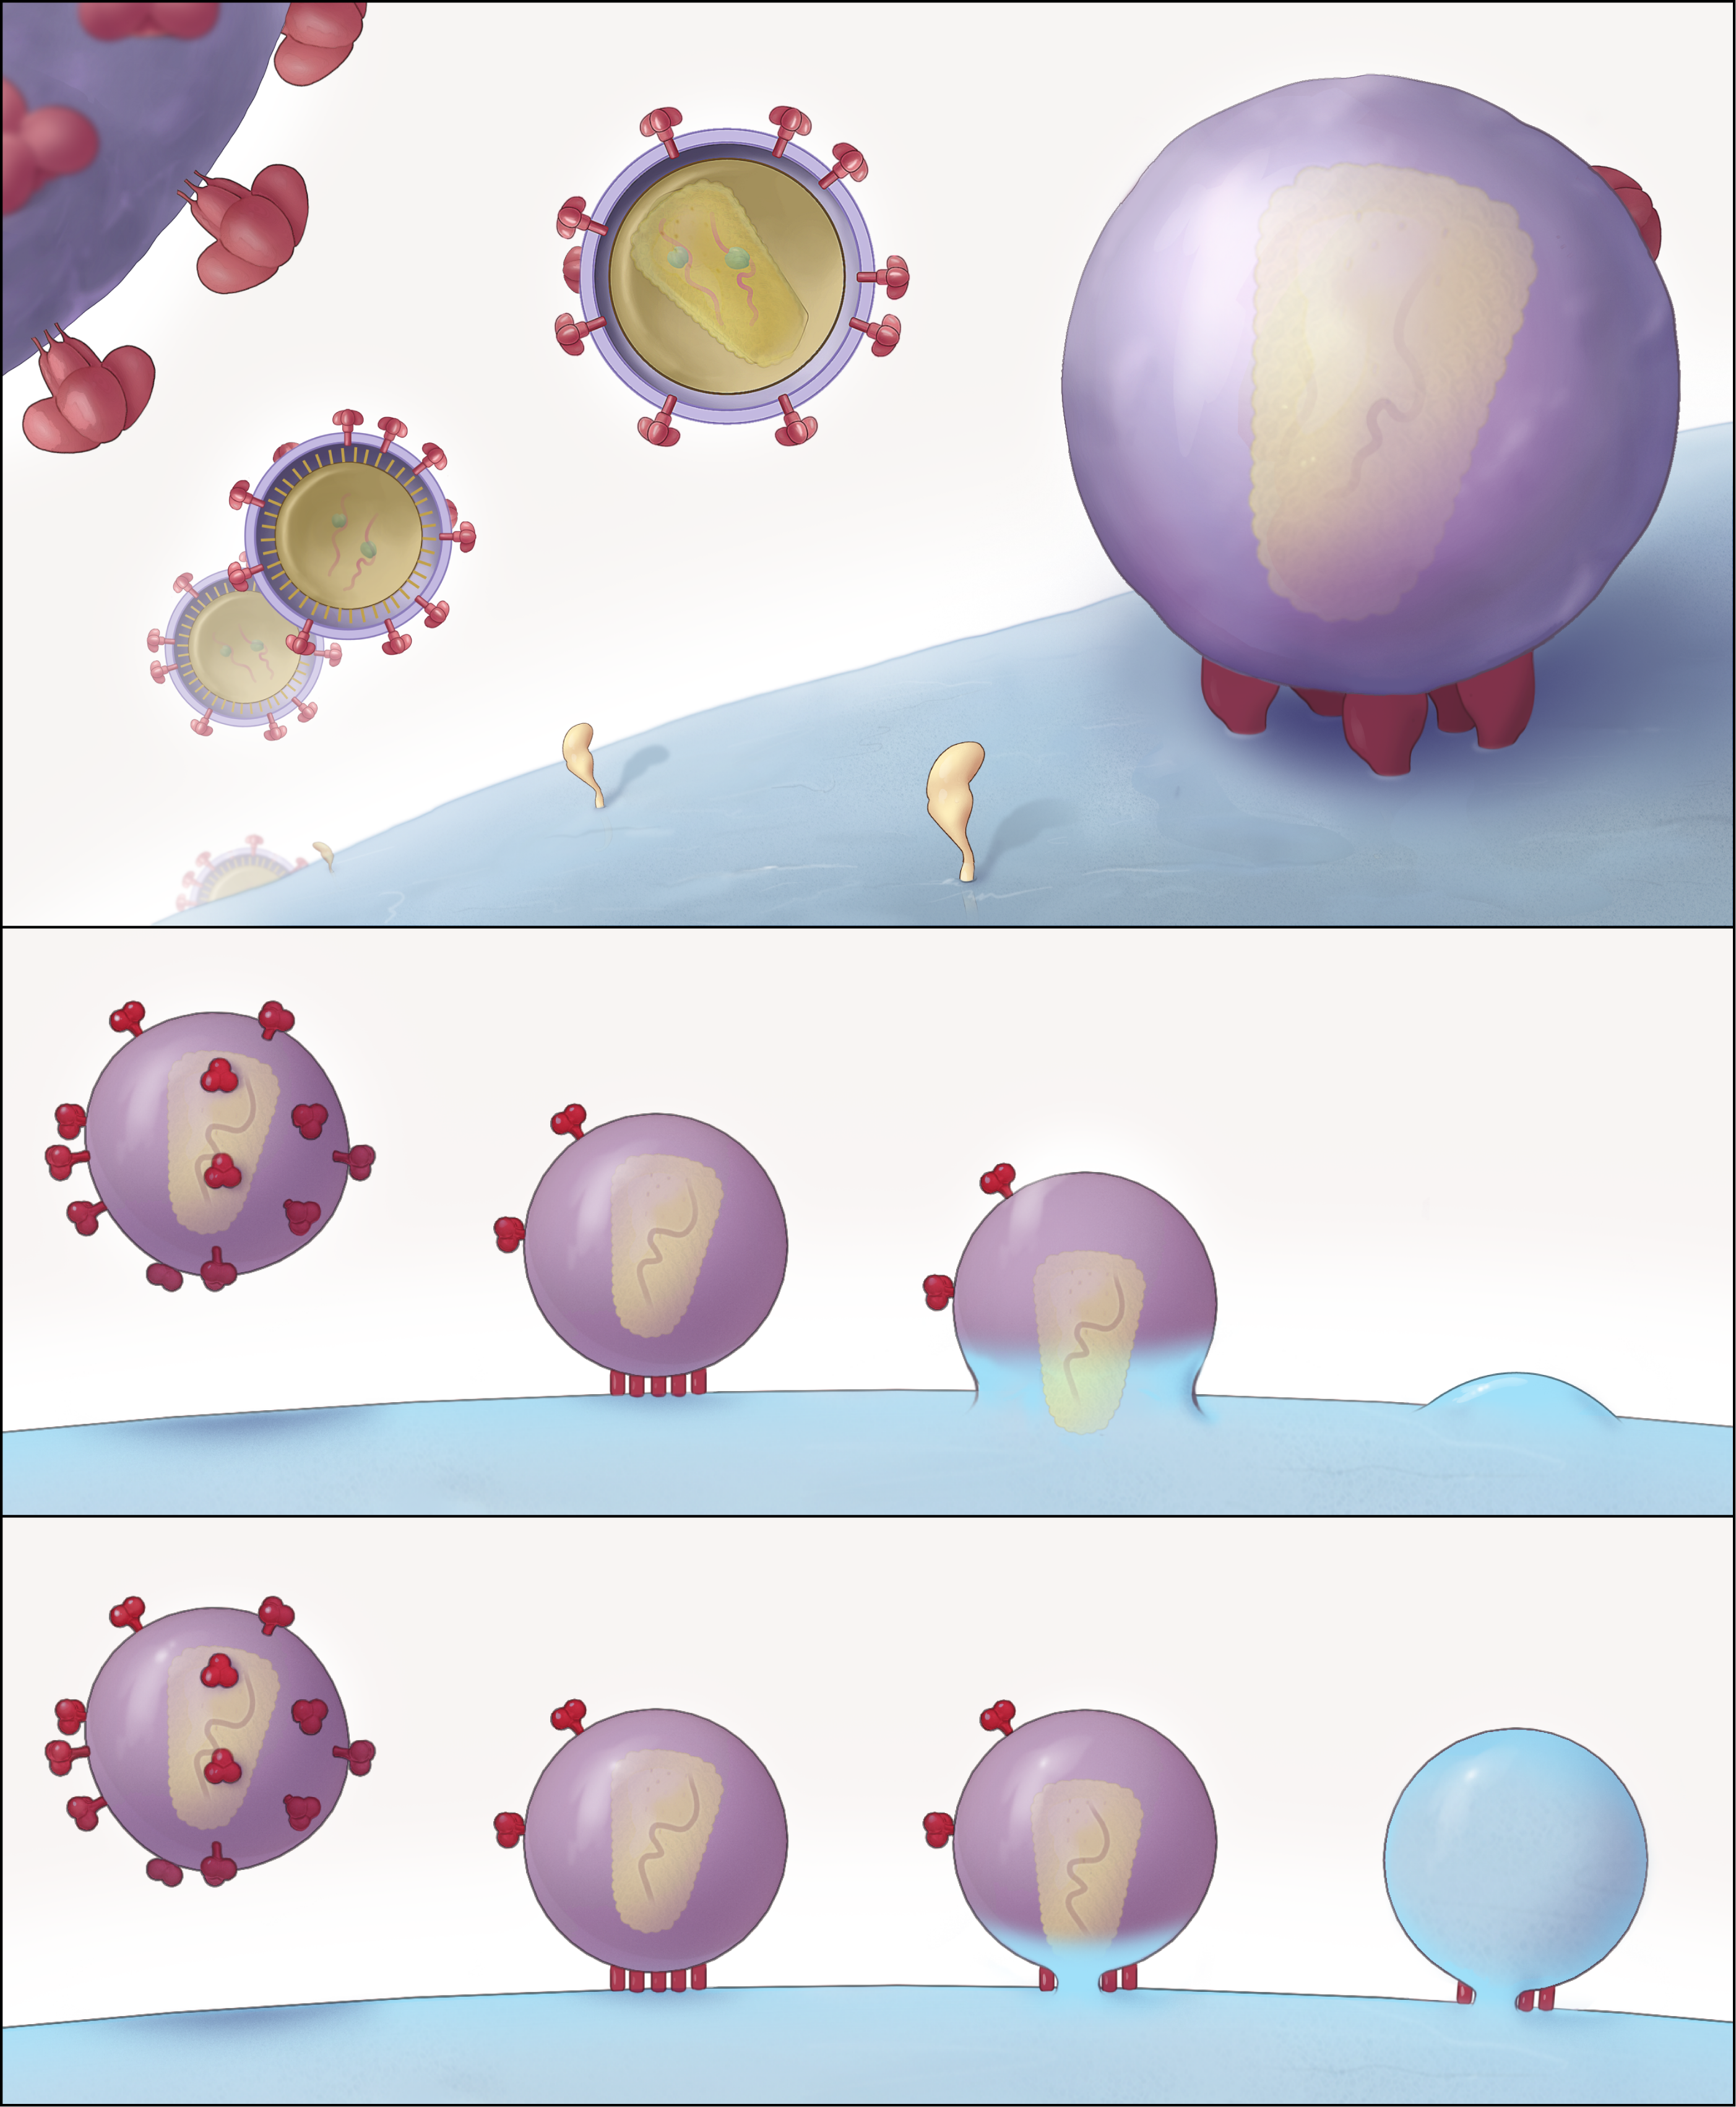
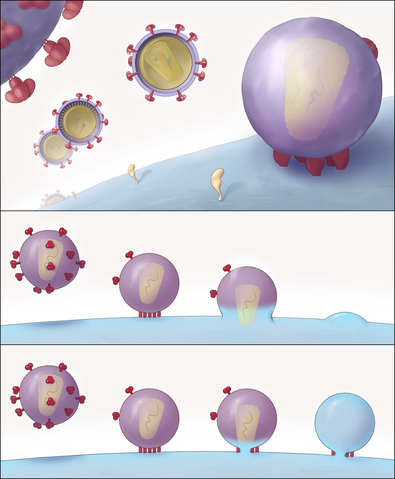
English: "Schematic Representation of the Key Structural Features of SIV and HIV-1 Entry into T Cells"
(A) Different stages of viral entry from budding, to maturation, to entry claw formation. For the SIV strain used here, viruses that are docked to the cell via an entry claw show very few, if any, viral spikes on their surface, whereas non-contacting viruses typically display between 60 and 100 spikes on their surface. The entry claw is composed of between five to seven anchors spanning the region between the virus and the cell, each ∼100 Å long, and spaced laterally by ∼150 Å. (B and C) Two alternative models for viral entry. In the global fusion model (B), the formation of the entry claw is followed by progressive fusion of the viral membrane across its width, leading to merger of the contents of the viral membrane with the cellular membrane. In the local fusion model (C), the formation of the entry claw is followed by the creation of a local pore centered at one of the rods, leading to delivery of the viral core into the cell." |
| Date | Published May 4, 2007 |
| Source |
Sougrat R, Bartesaghi A, Lifson JD, et al (May 2007). "Electron tomography of the contact between T cells and SIV/HIV-1: implications for viral entry". PLoS Pathog. 3 (5): e63. PMID 17480119. doi:10.1371/journal.ppat.0030063 Direct link to image: http://www.plospathogens.org/article/showImageLarge.action?uri=info%3Adoi%2F10.1371%2Fjournal.ppat.0030063.g008 |
| Author | Rachid Sougrat, Alberto Bartesaghi, Jeffrey D. Lifson, Adam E. Bennett, Julian W. Bess, Daniel J. Zabransky, Sriram Subramaniam |
| Permission (Reusing this file) |
[1] |
| Other versions | JPG version |
Licensing
|
This file is licensed under the Creative Commons Attribution 2.5 Generic license.
|
This file was published in a Public Library of Science journal. Their website states that the content of all PLOS journals is published under the Creative Commons Attribution 4.0 license (or its previous version depending on the publication date), unless indicated otherwise.
|
File history
Click on a date/time to view the file as it appeared at that time.
| Date/Time | Thumbnail | Dimensions | User | Comment | |
|---|---|---|---|---|---|
| current | 00:30, 11 June 2008 | | 2,805 × 3,405 (4.49 MB) | commons>Fvasconcellos | {{Information |Description="Schematic Representation of the Key Structural Features of SIV and HIV-1 Entry into T Cells" (A) Different stages of viral entry from budding, to maturation, to entry claw formation. For the SIV strain used here, viruses that |
File usage
The following page uses this file: