Alcohol-related traffic crashes in the United States
Alcohol-related traffic crashes are defined by the United States National Highway Traffic Safety Administration (NHTSA) as alcohol-related if either a driver or a non-motorist had a measurable or estimated BAC of 0.01 g/dl or above.[1]
This statistic includes any and all vehicular (including bicycle and motorcycle) accidents in which any alcohol has been consumed, or believed to have been consumed, by the driver, a passenger or a pedestrian associated with the accident. Thus, if a person who has consumed alcohol and has stopped for a red light is rear-ended by a completely sober but inattentive driver, the accident is listed as alcohol-related, although alcohol had nothing to do with causing the accident. Furthermore, if a sober motorist hits a drunk pedestrian, the accident is also listed as alcohol-related. Alcohol-related accidents are often mistakenly confused with alcohol-caused accidents. Some[2] have criticized the NHTSA for compiling this statistic since it may give the impression that drunk drivers cause a much higher percentage of accidents and does not accurately reflect the problem of drunk driving in the United States.
Nationally, 12.8% of all drivers involved in fatal accidents during 2013 are known to have been intoxicated according to the blood alcohol concentration (BAC laws) of their state.[citation needed] This number is based on a systematic examination of the official records of each and every accident involving a fatality during that year in the US.[citation needed] However, a majority of fatalities resulting from car accidents involving alcohol are from sober drivers who are hit by drunk drivers.
The higher number (about 40%) commonly reported refers to accidents defined as alcohol-related as estimated by the National Highway Traffic Safety Administration.
Each year, The Century Council, a national non-profit organization funded by a group of alcohol manufacturers, compiles a document of alcohol-related traffic fatalities. Between 1991 and 2013, the rate of alcohol-related traffic fatalities (ARTF) per 100,000 population has decreased 52% nationally, and 79% among youth under 21.[3]
NHTSA data


According to NHTSA, the 50 US states, the District of Columbia, and Puerto Rico all have BAC limits of 0.08 g/dL or lower.
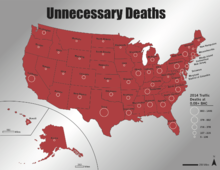
In 2016, in the USA, 10,497 people were killed in crashes involving alcohol-impaired drivers; this represents 28 percent of all traffic-related fatalities.[6] Sixty-two percent of the people killed in such a crash were drivers, 29% occupants, and 9% non-occupants.[6]
This data is described as
Total includes fatalities in crashes in which there was no driver (includes motorcycle riders) present.
In 2016, the states with the fewest fatalities due to alcohol-impaired drivers were Utah and Mississippi, with 128 and 52 killed (19%).[6]
Among drivers with BAC levels of 0.08% or higher involved in fatal crashes, 75% are aged between 21 and 44.[7]
Of all motorcyclists killed in crashes, 25% had BACs of 0.08% or greater.[7]
See also
- Foundation for Advancing Alcohol Responsibility, funded by a group of distillers
- Mothers Against Drunk Driving
- Transportation safety in the United States
References
- ↑ "Alcohol Involvement in Fatal Crashes, Comparison Among Countries - Background and Introduction - DOT HS 809 355". one.nhtsa.gov. Archived from the original on 2023-03-07. Retrieved 2023-02-05.
- ↑ "National Motorists Association - Driver Advocacy". National Motorists Association. Archived from the original on 2021-11-03. Retrieved 2023-02-05.
- ↑ "The Century Council's Research". Archived from the original on 2008-07-15. Retrieved 2008-06-24.
- ↑ "Senior Police Officer Gail Denise Thomas". The Officer Down Memorial Page (ODMP).
- ↑ "Stats". crashstats.nhtsa.dot.gov. Retrieved 2019-07-30.
- ↑ 6.0 6.1 6.2 "Traffic Safety Facts: Alcohol Impaired Driving" (PDF). National Highway Traffic Safety Administration. United States Department of Transportation. October 2017. Archived from the original on 31 August 2022. Retrieved 28 October 2022.
- ↑ 7.0 7.1 "Impaired Driving: Get the Facts | Motor Vehicle Safety | CDC Injury Center". www.cdc.gov. March 28, 2019. Archived from the original on July 28, 2017. Retrieved February 5, 2023.
External links
- Traffic Safety Facts: Alcohol-Impaired Driving Archived 2022-09-30 at the Wayback Machine, NHTSA
- Drunk Driving Fatalities Archived 2023-02-07 at the Wayback Machine, Foundation for Advancing Alcohol Responsibility
- All articles with unsourced statements
- Articles with unsourced statements from June 2019
- Articles with invalid date parameter in template
- Articles with unsourced statements from August 2008
- Webarchive template wayback links
- Transportation in the United States
- Alcohol in the United States
- Driving under the influence
