File:US unemployment rates U3 and U6.png
Jump to navigation
Jump to search

Size of this preview: 800 × 461 pixels. Other resolutions: 320 × 185 pixels | 640 × 369 pixels | 1,024 × 591 pixels | 1,380 × 796 pixels.
Original file (1,380 × 796 pixels, file size: 204 KB, MIME type: image/png)
Summary
| Description |
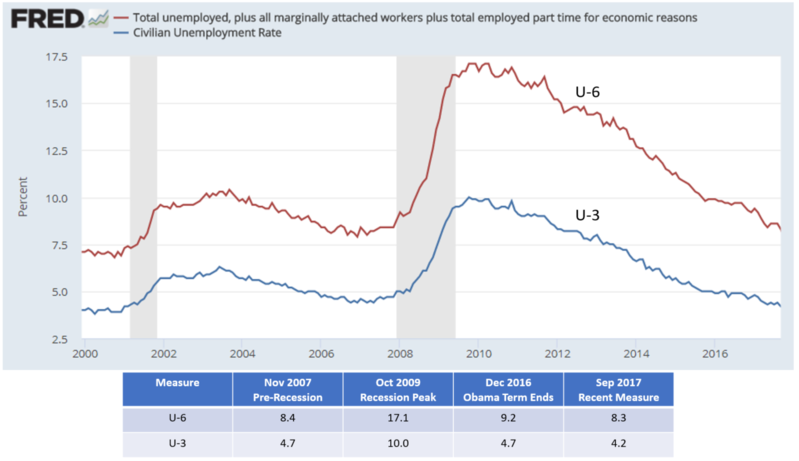
English: Line chart showing unemployment rate trends from 2000-2017, for the U3 and U6 measures. |
| Date | |
| Source |
Own work, based on
|
| Author | Farcaster |
Licensing
| This chart is ineligible for copyright and therefore in the public domain, because it consists entirely of information that is common property and contains no original authorship. For more information, see Commons:Threshold of originality § Charts
|
File history
Click on a date/time to view the file as it appeared at that time.
| Date/Time | Thumbnail | Dimensions | User | Comment | |
|---|---|---|---|---|---|
| current | 18:37, 4 November 2017 | | 1,380 × 796 (204 KB) | commons>Farcaster | Update file |
File usage
There are no pages that use this file.