File:Peak Envelope Power.svg
Jump to navigation
Jump to search

Size of this PNG preview of this SVG file: 278 × 215 pixels. Other resolutions: 310 × 240 pixels | 621 × 480 pixels | 993 × 768 pixels | 1,280 × 990 pixels | 2,560 × 1,980 pixels.
Original file (SVG file, nominally 278 × 215 pixels, file size: 254 KB)
File history
Click on a date/time to view the file as it appeared at that time.
| Date/Time | Thumbnail | Dimensions | User | Comment | |
|---|---|---|---|---|---|
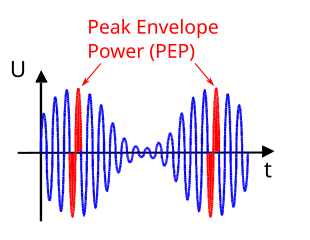
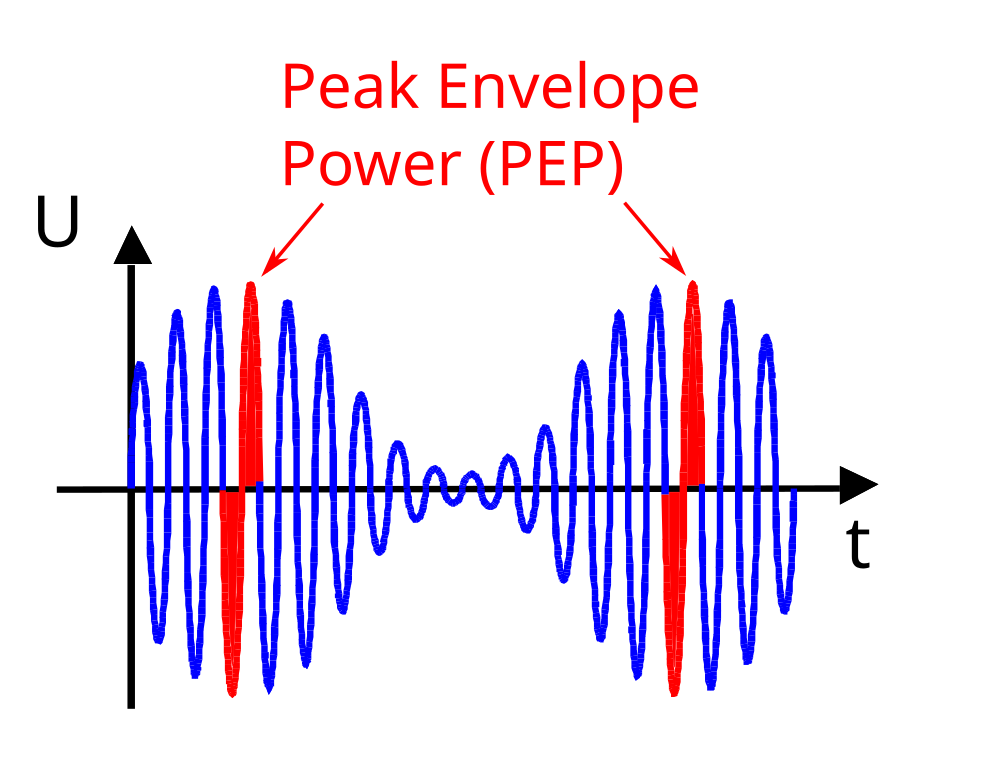
| current | 19:01, 2 April 2020 | | 278 × 215 (254 KB) | commons>Wdwd | == {{int:filedesc}} == {{Information |Description={{de|Darstellung der Hüllkurvenspitzenleistung (engl. Peak Envelope Power, PEP) am Beispiel eines AM-modulierten Signals. Die PEP ist der Effektivwert der Leistung der größten Periode einer HF-Schwingung. Bei einem AM-Signal also die Periode der HF-Schwingung mit der maximalen Amplitude und im Diagramm mit einer roten Fläche (Leistungsfläche) dargestellt.}} {{en|Sketch of the peak envelope power (PEP) using the example of an AM-modulated sign... |
File usage
There are no pages that use this file.