File:Guo 2023 Asia IVT projections.jpg
Jump to navigation
Jump to search

Size of this preview: 800 × 556 pixels. Other resolutions: 320 × 222 pixels | 640 × 445 pixels | 1,024 × 712 pixels | 1,280 × 890 pixels | 2,128 × 1,479 pixels.
Original file (2,128 × 1,479 pixels, file size: 891 KB, MIME type: image/jpeg)
File history
Click on a date/time to view the file as it appeared at that time.
| Date/Time | Thumbnail | Dimensions | User | Comment | |
|---|---|---|---|---|---|
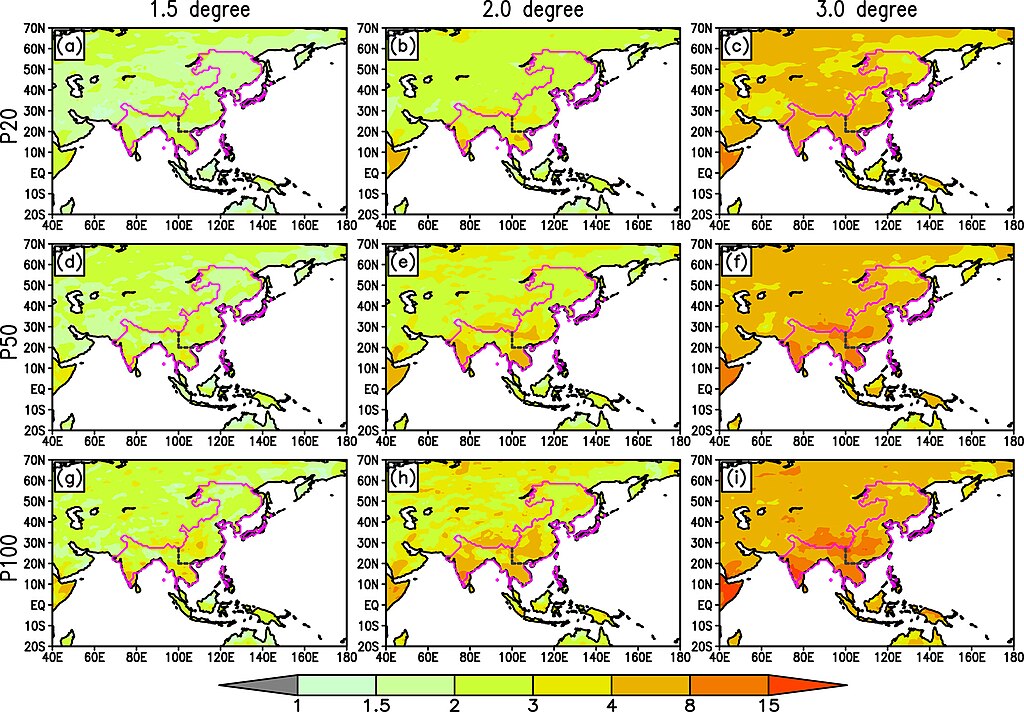
| current | 17:43, 9 May 2024 | | 2,128 × 1,479 (891 KB) | commons>InformationToKnowledge | This graphic, from [https://agupubs.onlinelibrary.wiley.com/doi/10.1029/2023EF003583 Guo et al., 2023], shows how the 20-year, 50-year and 100-year extremes in integrated water transport (a metric directly related to precipitation) would increase over Asia under the three different levels of climate change. |
File usage
There are no pages that use this file.